29
/
en
AIzaSyAYiBZKx7MnpbEhh9jyipgxe19OcubqV5w
April 1, 2024
148216
Guyana
GUY
true
2
1
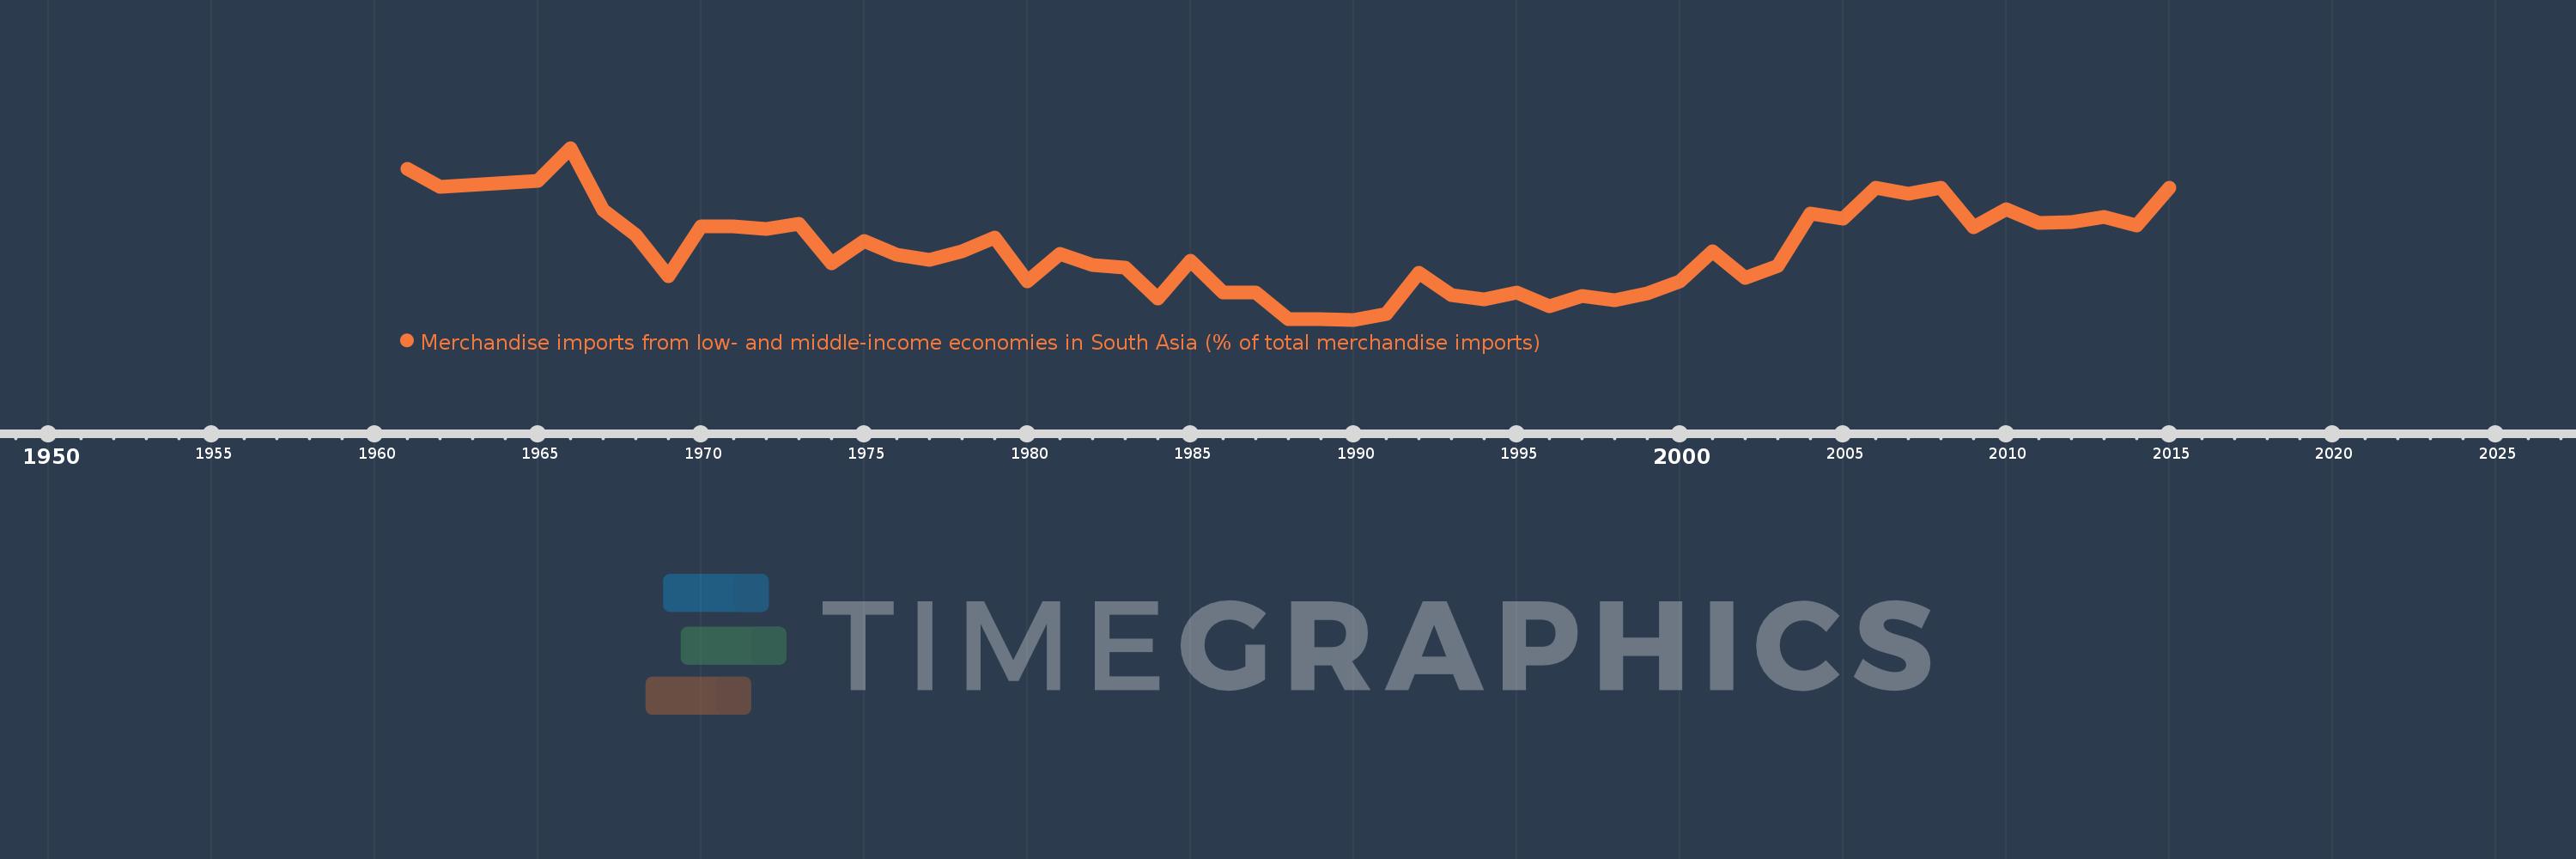
Merchandise imports from low- and middle-income economies in South Asia (% of total merchandise imports)
2015,2014,2013,2012,2011,2010,2009,2008,2007,2006,2005,2004,2003,2002,2001,2000,1999,1998,1997,1996,1995,1994,1993,1992,1991,1990,1989,1988,1987,1986,1985,1984,1983,1982,1981,1980,1979,1978,1977,1976,1975,1974,1973,1972,1971,1970,1969,1968,1967,1966,1965,1962,1961
This statistics in other country:
AfghanistanAlbaniaAlgeriaAngolaAntigua and BarbudaArab WorldArgentinaArmeniaArubaAustraliaAustriaAzerbaijanBahamas, TheBahrainBangladeshBarbadosBelarusBelgiumBelizeBeninBermudaBoliviaBrazilBrunei DarussalamBulgariaBurkina FasoBurundiCabo VerdeCambodiaCameroonCanadaCaribbean small statesCentral African RepublicCentral Europe and the BalticsChadChileChinaColombiaCongo, Dem. Rep.Congo, Rep.Costa RicaCote d'IvoireCroatiaCubaCyprusCzech RepublicDenmarkDjiboutiDominicaDominican RepublicEarly-demographic dividendEast Asia & PacificEast Asia & Pacific (excluding high income)East Asia & Pacific (IDA & IBRD countries)EcuadorEgypt, Arab Rep.El SalvadorEstoniaEthiopiaEuro areaEurope & Central AsiaEurope & Central Asia (excluding high income)Europe & Central Asia (IDA & IBRD countries)European UnionFaroe IslandsFijiFinlandFragile and conflict affected situationsFranceGabonGambia, TheGeorgiaGermanyGhanaGibraltarGreeceGreenlandGrenadaGuatemalaGuineaGuyanaHaitiHeavily indebted poor countries (HIPC)High incomeHondurasHong Kong SAR, ChinaHungaryIBRD onlyIcelandIDA & IBRD totalIDA blendIDA onlyIDA totalIndiaIndonesiaIran, Islamic Rep.IraqIrelandIsraelItalyJamaicaJapanJordanKazakhstanKenyaKiribatiKorea, Dem. People’s Rep.Korea, Rep.KosovoKuwaitKyrgyz RepublicLao PDRLate-demographic dividendLatin America & Caribbean Latin America & Caribbean (excluding high income)Latin America & the Caribbean (IDA & IBRD countries)LatviaLeast developed countries: UN classificationLebanonLiberiaLibyaLithuaniaLow & middle incomeLow incomeLower middle incomeLuxembourgMacao SAR, ChinaMacedonia, FYRMadagascarMalawiMalaysiaMaldivesMaliMaltaMauritaniaMauritiusMexicoMiddle East & North AfricaMiddle East & North Africa (excluding high income)Middle East & North Africa (IDA & IBRD countries)Middle incomeMoldovaMongoliaMontenegroMoroccoMozambiqueMyanmarNauruNepalNetherlandsNew CaledoniaNew ZealandNicaraguaNigerNigeriaNorth AmericaNorwayOECD membersOmanOther small statesPacific island small statesPakistanPanamaPapua New GuineaParaguayPeruPhilippinesPolandPortugalPost-demographic dividendPre-demographic dividendQatarRomaniaRussian FederationRwandaSamoaSaudi ArabiaSenegalSerbiaSeychellesSierra LeoneSingaporeSlovak RepublicSloveniaSmall statesSolomon IslandsSomaliaSouth AfricaSouth AsiaSouth Asia (IDA & IBRD)SpainSri LankaSt. Kitts and NevisSt. LuciaSt. Vincent and the GrenadinesSub-Saharan Africa Sub-Saharan Africa (excluding high income)Sub-Saharan Africa (IDA & IBRD countries)SudanSurinameSwedenSwitzerlandSyrian Arab RepublicTajikistanTanzaniaThailandTogoTongaTrinidad and TobagoTunisiaTurkeyTurkmenistanUgandaUkraineUnited Arab EmiratesUnited KingdomUnited StatesUpper middle incomeUruguayUzbekistanVanuatuVenezuela, RBVietnamWorldYemen, Rep.ZambiaZimbabwe Timeline:
This timeline shows a graph from 1961 to 2015 of Guyana. No data until 1960. Number of actual observations by date: 53.
Source name:
World Development Indicators
Source organization:
World Bank staff estimates based data from International Monetary Fund's Direction of Trade database.
Categories, topics:
Private Sector, Trade
Last updated:
apr 23, 2017
Indicators value changes by year
At the date of observation
Value
Absolute change
Change from previous value
jan 1, 1961
1.858
+1.858
0.0%
jan 1, 1962
1.639
-0.219
-11.78%
jan 1, 1965
1.712
+0.073
4.45%
jan 1, 1966
2.107
+0.395
23.07%
jan 1, 1967
1.357
-0.75
-35.6%
jan 1, 1968
1.057
-0.3
-22.14%
jan 1, 1969
0.566
-0.491
-46.48%
jan 1, 1970
1.163
+0.597
105.63%
jan 1, 1971
1.162
-0.001
-0.1%
jan 1, 1972
1.133
-0.028
-2.45%
jan 1, 1973
1.193
+0.06
5.29%
jan 1, 1974
0.725
-0.468
-39.25%
jan 1, 1975
0.985
+0.26
35.86%
jan 1, 1976
0.822
-0.163
-16.54%
jan 1, 1977
0.758
-0.064
-7.73%
jan 1, 1978
0.862
+0.104
13.71%
jan 1, 1979
1.033
+0.17
19.75%
jan 1, 1980
0.503
-0.53
-51.3%
jan 1, 1981
0.832
+0.329
65.48%
jan 1, 1982
0.705
-0.127
-15.3%
jan 1, 1983
0.668
-0.037
-5.2%
jan 1, 1984
0.296
-0.372
-55.65%
jan 1, 1985
0.757
+0.46
155.32%
jan 1, 1986
0.367
-0.389
-51.46%
jan 1, 1987
0.367
0.0
0.0%
jan 1, 1988
0.055
-0.312
-84.91%
jan 1, 1989
0.049
-0.006
-10.98%
jan 1, 1990
0.044
-0.005
-9.9%
jan 1, 1991
0.115
+0.07
157.61%
jan 1, 1992
0.613
+0.498
434.83%
jan 1, 1993
0.341
-0.272
-44.4%
jan 1, 1994
0.285
-0.055
-16.28%
jan 1, 1995
0.374
+0.089
31.2%
jan 1, 1996
0.203
-0.171
-45.79%
jan 1, 1997
0.332
+0.129
63.81%
jan 1, 1998
0.274
-0.058
-17.45%
jan 1, 1999
0.357
+0.083
30.29%
jan 1, 2000
0.501
+0.144
40.35%
jan 1, 2001
0.871
+0.37
73.78%
jan 1, 2002
0.545
-0.326
-37.46%
jan 1, 2003
0.69
+0.145
26.58%
jan 1, 2004
1.315
+0.625
90.58%
jan 1, 2005
1.253
-0.061
-4.66%
jan 1, 2006
1.629
+0.376
29.98%
jan 1, 2007
1.555
-0.074
-4.55%
jan 1, 2008
1.629
+0.074
4.75%
jan 1, 2009
1.15
-0.479
-29.42%
jan 1, 2010
1.376
+0.226
19.69%
jan 1, 2011
1.211
-0.165
-11.96%
jan 1, 2012
1.22
+0.008
0.67%
jan 1, 2013
1.28
+0.061
4.97%
jan 1, 2014
1.177
-0.103
-8.07%
jan 1, 2015
1.625
+0.448
38.06%
Ranking of countries by current statistics by years


Comments: