29
/
en
AIzaSyAYiBZKx7MnpbEhh9jyipgxe19OcubqV5w
April 1, 2024
35164
Heavily indebted poor countries (HIPC)
HPC
false
2
1
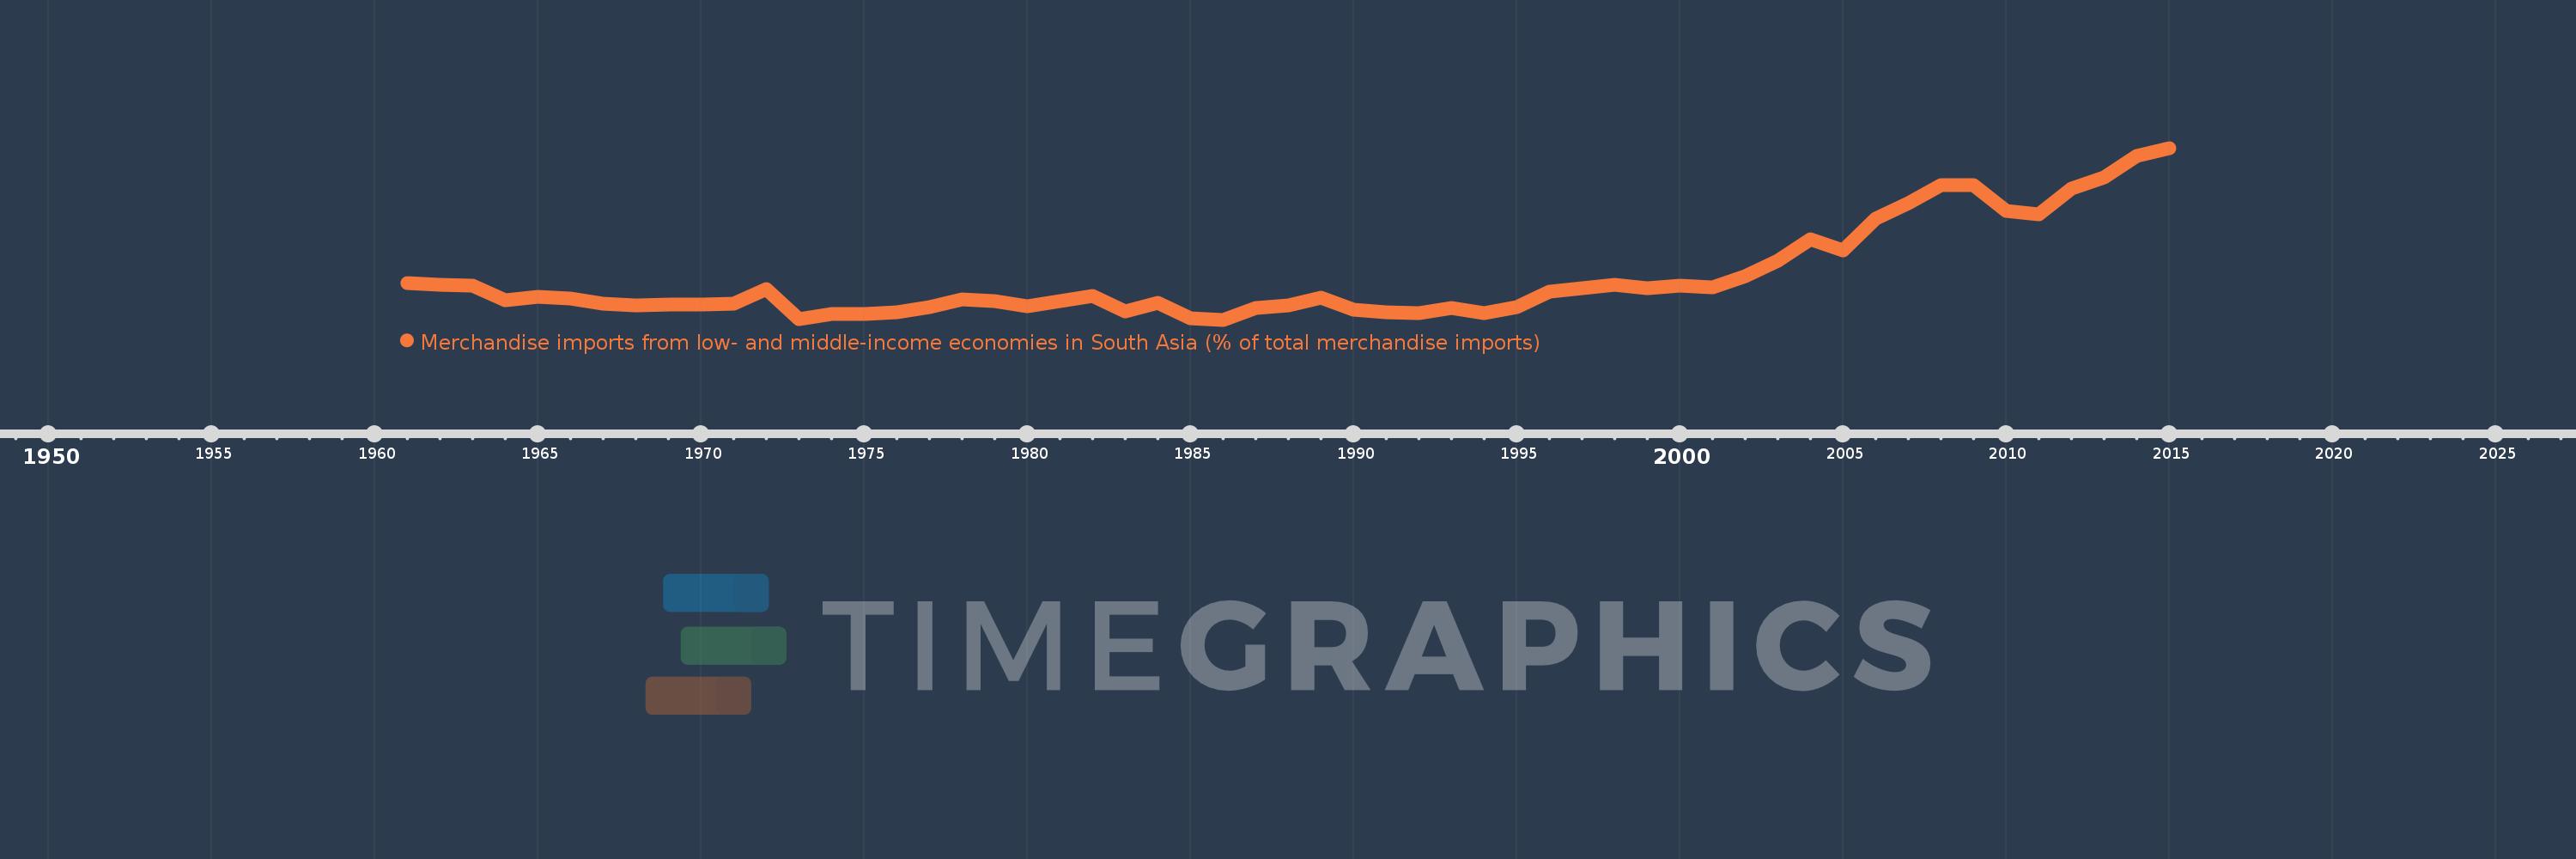
Merchandise imports from low- and middle-income economies in South Asia (% of total merchandise imports)
2015,2014,2013,2012,2011,2010,2009,2008,2007,2006,2005,2004,2003,2002,2001,2000,1999,1998,1997,1996,1995,1994,1993,1992,1991,1990,1989,1988,1987,1986,1985,1984,1983,1982,1981,1980,1979,1978,1977,1976,1975,1974,1973,1972,1971,1970,1969,1968,1967,1966,1965,1964,1963,1962,1961
This statistics in other country:
AfghanistanAlbaniaAlgeriaAngolaAntigua and BarbudaArab WorldArgentinaArmeniaArubaAustraliaAustriaAzerbaijanBahamas, TheBahrainBangladeshBarbadosBelarusBelgiumBelizeBeninBermudaBoliviaBrazilBrunei DarussalamBulgariaBurkina FasoBurundiCabo VerdeCambodiaCameroonCanadaCaribbean small statesCentral African RepublicCentral Europe and the BalticsChadChileChinaColombiaCongo, Dem. Rep.Congo, Rep.Costa RicaCote d'IvoireCroatiaCubaCyprusCzech RepublicDenmarkDjiboutiDominicaDominican RepublicEarly-demographic dividendEast Asia & PacificEast Asia & Pacific (excluding high income)East Asia & Pacific (IDA & IBRD countries)EcuadorEgypt, Arab Rep.El SalvadorEstoniaEthiopiaEuro areaEurope & Central AsiaEurope & Central Asia (excluding high income)Europe & Central Asia (IDA & IBRD countries)European UnionFaroe IslandsFijiFinlandFragile and conflict affected situationsFranceGabonGambia, TheGeorgiaGermanyGhanaGibraltarGreeceGreenlandGrenadaGuatemalaGuineaGuyanaHaitiHeavily indebted poor countries (HIPC)High incomeHondurasHong Kong SAR, ChinaHungaryIBRD onlyIcelandIDA & IBRD totalIDA blendIDA onlyIDA totalIndiaIndonesiaIran, Islamic Rep.IraqIrelandIsraelItalyJamaicaJapanJordanKazakhstanKenyaKiribatiKorea, Dem. People’s Rep.Korea, Rep.KosovoKuwaitKyrgyz RepublicLao PDRLate-demographic dividendLatin America & Caribbean Latin America & Caribbean (excluding high income)Latin America & the Caribbean (IDA & IBRD countries)LatviaLeast developed countries: UN classificationLebanonLiberiaLibyaLithuaniaLow & middle incomeLow incomeLower middle incomeLuxembourgMacao SAR, ChinaMacedonia, FYRMadagascarMalawiMalaysiaMaldivesMaliMaltaMauritaniaMauritiusMexicoMiddle East & North AfricaMiddle East & North Africa (excluding high income)Middle East & North Africa (IDA & IBRD countries)Middle incomeMoldovaMongoliaMontenegroMoroccoMozambiqueMyanmarNauruNepalNetherlandsNew CaledoniaNew ZealandNicaraguaNigerNigeriaNorth AmericaNorwayOECD membersOmanOther small statesPacific island small statesPakistanPanamaPapua New GuineaParaguayPeruPhilippinesPolandPortugalPost-demographic dividendPre-demographic dividendQatarRomaniaRussian FederationRwandaSamoaSaudi ArabiaSenegalSerbiaSeychellesSierra LeoneSingaporeSlovak RepublicSloveniaSmall statesSolomon IslandsSomaliaSouth AfricaSouth AsiaSouth Asia (IDA & IBRD)SpainSri LankaSt. Kitts and NevisSt. LuciaSt. Vincent and the GrenadinesSub-Saharan Africa Sub-Saharan Africa (excluding high income)Sub-Saharan Africa (IDA & IBRD countries)SudanSurinameSwedenSwitzerlandSyrian Arab RepublicTajikistanTanzaniaThailandTogoTongaTrinidad and TobagoTunisiaTurkeyTurkmenistanUgandaUkraineUnited Arab EmiratesUnited KingdomUnited StatesUpper middle incomeUruguayUzbekistanVanuatuVenezuela, RBVietnamWorldYemen, Rep.ZambiaZimbabwe Timeline:
This timeline shows a graph from 1961 to 2015 of Heavily indebted poor countries (HIPC). No data until 1960. Number of actual observations by date: 55.
Source name:
World Development Indicators
Source organization:
World Bank staff estimates based data from International Monetary Fund's Direction of Trade database.
Categories, topics:
Private Sector, Trade
Last updated:
apr 23, 2017
Indicators value changes by year
At the date of observation
Value
Absolute change
Change from previous value
jan 1, 1961
2.578
+2.578
0.0%
jan 1, 1962
2.521
-0.057
-2.22%
jan 1, 1963
2.499
-0.022
-0.86%
jan 1, 1964
1.938
-0.562
-22.47%
jan 1, 1965
2.06
+0.123
6.33%
jan 1, 1966
1.998
-0.062
-3.01%
jan 1, 1967
1.799
-0.199
-9.98%
jan 1, 1968
1.724
-0.074
-4.14%
jan 1, 1969
1.763
+0.038
2.23%
jan 1, 1970
1.78
+0.017
0.99%
jan 1, 1971
1.796
+0.016
0.88%
jan 1, 1972
2.347
+0.551
30.68%
jan 1, 1973
1.225
-1.122
-47.8%
jan 1, 1974
1.425
+0.2
16.32%
jan 1, 1975
1.403
-0.022
-1.52%
jan 1, 1976
1.48
+0.076
5.44%
jan 1, 1977
1.675
+0.195
13.18%
jan 1, 1978
1.972
+0.297
17.74%
jan 1, 1979
1.893
-0.078
-3.98%
jan 1, 1980
1.694
-0.2
-10.54%
jan 1, 1981
1.905
+0.211
12.47%
jan 1, 1982
2.103
+0.198
10.39%
jan 1, 1983
1.526
-0.577
-27.43%
jan 1, 1984
1.839
+0.313
20.53%
jan 1, 1985
1.253
-0.586
-31.87%
jan 1, 1986
1.194
-0.059
-4.69%
jan 1, 1987
1.632
+0.438
36.64%
jan 1, 1988
1.725
+0.093
5.72%
jan 1, 1989
2.039
+0.314
18.2%
jan 1, 1990
1.59
-0.449
-22.01%
jan 1, 1991
1.47
-0.121
-7.59%
jan 1, 1992
1.454
-0.015
-1.03%
jan 1, 1993
1.643
+0.189
12.98%
jan 1, 1994
1.433
-0.21
-12.79%
jan 1, 1995
1.683
+0.25
17.43%
jan 1, 1996
2.269
+0.586
34.85%
jan 1, 1997
2.383
+0.114
5.01%
jan 1, 1998
2.518
+0.136
5.69%
jan 1, 1999
2.403
-0.116
-4.6%
jan 1, 2000
2.499
+0.096
4.0%
jan 1, 2001
2.424
-0.075
-2.99%
jan 1, 2002
2.863
+0.439
18.1%
jan 1, 2003
3.445
+0.583
20.35%
jan 1, 2004
4.263
+0.818
23.73%
jan 1, 2005
3.848
-0.414
-9.72%
jan 1, 2006
5.051
+1.202
31.24%
jan 1, 2007
5.636
+0.585
11.59%
jan 1, 2008
6.317
+0.681
12.08%
jan 1, 2009
6.314
-0.003
-0.04%
jan 1, 2010
5.323
-0.991
-15.69%
jan 1, 2011
5.219
-0.105
-1.97%
jan 1, 2012
6.184
+0.965
18.49%
jan 1, 2013
6.622
+0.439
7.09%
jan 1, 2014
7.427
+0.804
12.15%
jan 1, 2015
7.737
+0.311
4.18%
Ranking of countries by current statistics by years


Comments: