29
/
en
AIzaSyAYiBZKx7MnpbEhh9jyipgxe19OcubqV5w
April 1, 2024
244759
Somalia
SOM
true
2
1
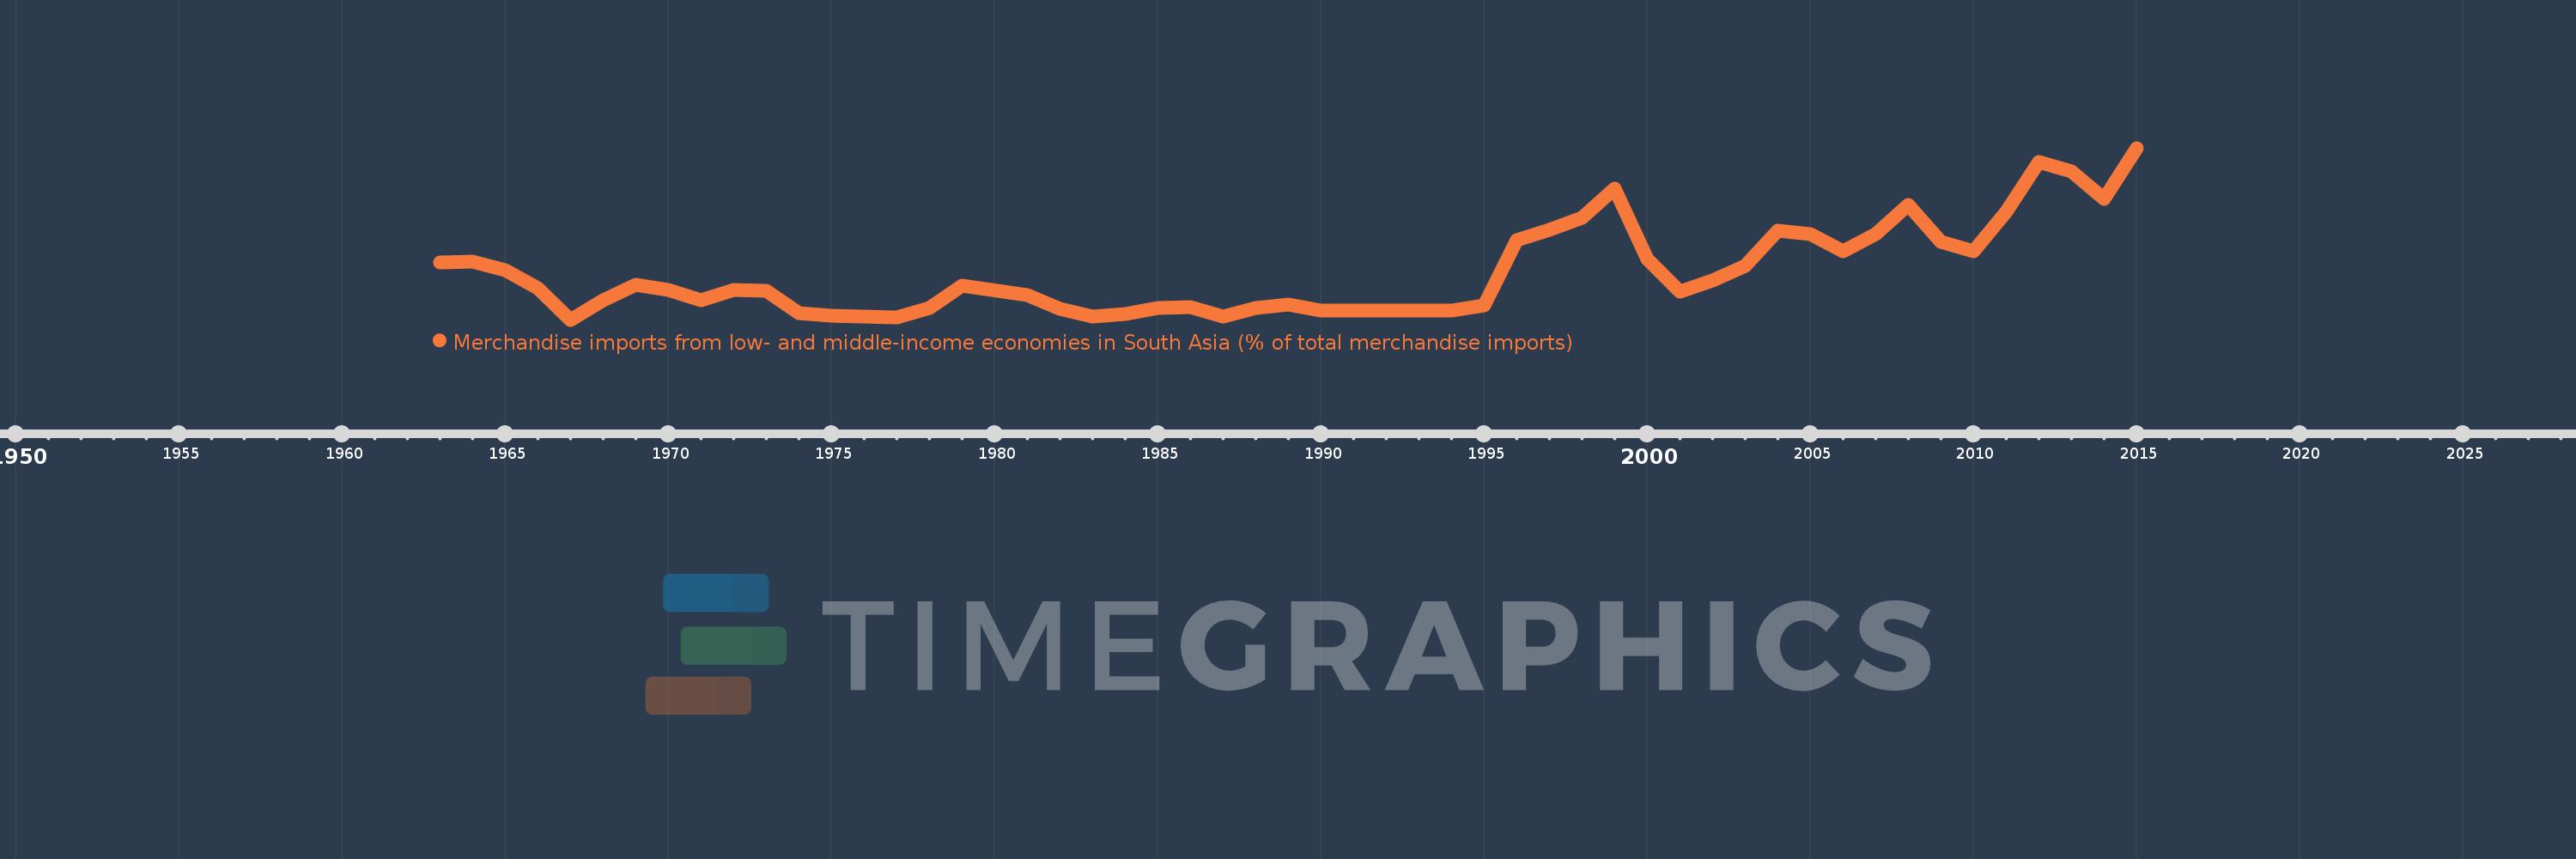
Merchandise imports from low- and middle-income economies in South Asia (% of total merchandise imports)
2015,2014,2013,2012,2011,2010,2009,2008,2007,2006,2005,2004,2003,2002,2001,2000,1999,1998,1997,1996,1995,1994,1993,1992,1991,1990,1989,1988,1987,1986,1985,1984,1983,1982,1981,1979,1978,1977,1976,1975,1974,1973,1972,1971,1970,1969,1968,1967,1966,1965,1964,1963
This statistics in other country:
AfghanistanAlbaniaAlgeriaAngolaAntigua and BarbudaArab WorldArgentinaArmeniaArubaAustraliaAustriaAzerbaijanBahamas, TheBahrainBangladeshBarbadosBelarusBelgiumBelizeBeninBermudaBoliviaBrazilBrunei DarussalamBulgariaBurkina FasoBurundiCabo VerdeCambodiaCameroonCanadaCaribbean small statesCentral African RepublicCentral Europe and the BalticsChadChileChinaColombiaCongo, Dem. Rep.Congo, Rep.Costa RicaCote d'IvoireCroatiaCubaCyprusCzech RepublicDenmarkDjiboutiDominicaDominican RepublicEarly-demographic dividendEast Asia & PacificEast Asia & Pacific (excluding high income)East Asia & Pacific (IDA & IBRD countries)EcuadorEgypt, Arab Rep.El SalvadorEstoniaEthiopiaEuro areaEurope & Central AsiaEurope & Central Asia (excluding high income)Europe & Central Asia (IDA & IBRD countries)European UnionFaroe IslandsFijiFinlandFragile and conflict affected situationsFranceGabonGambia, TheGeorgiaGermanyGhanaGibraltarGreeceGreenlandGrenadaGuatemalaGuineaGuyanaHaitiHeavily indebted poor countries (HIPC)High incomeHondurasHong Kong SAR, ChinaHungaryIBRD onlyIcelandIDA & IBRD totalIDA blendIDA onlyIDA totalIndiaIndonesiaIran, Islamic Rep.IraqIrelandIsraelItalyJamaicaJapanJordanKazakhstanKenyaKiribatiKorea, Dem. People’s Rep.Korea, Rep.KosovoKuwaitKyrgyz RepublicLao PDRLate-demographic dividendLatin America & Caribbean Latin America & Caribbean (excluding high income)Latin America & the Caribbean (IDA & IBRD countries)LatviaLeast developed countries: UN classificationLebanonLiberiaLibyaLithuaniaLow & middle incomeLow incomeLower middle incomeLuxembourgMacao SAR, ChinaMacedonia, FYRMadagascarMalawiMalaysiaMaldivesMaliMaltaMauritaniaMauritiusMexicoMiddle East & North AfricaMiddle East & North Africa (excluding high income)Middle East & North Africa (IDA & IBRD countries)Middle incomeMoldovaMongoliaMontenegroMoroccoMozambiqueMyanmarNauruNepalNetherlandsNew CaledoniaNew ZealandNicaraguaNigerNigeriaNorth AmericaNorwayOECD membersOmanOther small statesPacific island small statesPakistanPanamaPapua New GuineaParaguayPeruPhilippinesPolandPortugalPost-demographic dividendPre-demographic dividendQatarRomaniaRussian FederationRwandaSamoaSaudi ArabiaSenegalSerbiaSeychellesSierra LeoneSingaporeSlovak RepublicSloveniaSmall statesSolomon IslandsSomaliaSouth AfricaSouth AsiaSouth Asia (IDA & IBRD)SpainSri LankaSt. Kitts and NevisSt. LuciaSt. Vincent and the GrenadinesSub-Saharan Africa Sub-Saharan Africa (excluding high income)Sub-Saharan Africa (IDA & IBRD countries)SudanSurinameSwedenSwitzerlandSyrian Arab RepublicTajikistanTanzaniaThailandTogoTongaTrinidad and TobagoTunisiaTurkeyTurkmenistanUgandaUkraineUnited Arab EmiratesUnited KingdomUnited StatesUpper middle incomeUruguayUzbekistanVanuatuVenezuela, RBVietnamWorldYemen, Rep.ZambiaZimbabwe Timeline:
This timeline shows a graph from 1963 to 2015 of Somalia. No data until 1962. Number of actual observations by date: 52.
Source name:
World Development Indicators
Source organization:
World Bank staff estimates based data from International Monetary Fund's Direction of Trade database.
Categories, topics:
Private Sector, Trade
Last updated:
apr 23, 2017
Indicators value changes by year
Maximum:
19.842
jan 1, 2015
At the date of observation
Value
Absolute change
Change from previous value
jan 1, 1963
6.614
+6.614
0.0%
jan 1, 1964
6.726
+0.113
1.7%
jan 1, 1965
5.751
-0.975
-14.5%
jan 1, 1966
3.651
-2.1
-36.52%
jan 1, 1967
0.0
-3.651
-100.0%
jan 1, 1968
2.288
+2.288
%
jan 1, 1969
4.04
+1.753
76.62%
jan 1, 1970
3.394
-0.647
-16.0%
jan 1, 1971
2.228
-1.166
-34.35%
jan 1, 1972
3.489
+1.261
56.58%
jan 1, 1973
3.299
-0.189
-5.43%
jan 1, 1974
0.753
-2.546
-77.17%
jan 1, 1975
0.427
-0.326
-43.3%
jan 1, 1976
0.343
-0.084
-19.58%
jan 1, 1977
0.26
-0.083
-24.22%
jan 1, 1978
1.374
+1.114
428.02%
jan 1, 1979
3.895
+2.521
183.48%
jan 1, 1981
2.831
-1.064
-27.31%
jan 1, 1982
1.243
-1.588
-56.09%
jan 1, 1983
0.338
-0.905
-72.77%
jan 1, 1984
0.675
+0.337
99.57%
jan 1, 1985
1.323
+0.648
95.93%
jan 1, 1986
1.44
+0.116
8.8%
jan 1, 1987
0.384
-1.056
-73.33%
jan 1, 1988
1.361
+0.977
254.43%
jan 1, 1989
1.722
+0.361
26.51%
jan 1, 1990
1.078
-0.644
-37.38%
jan 1, 1991
1.015
-0.063
-5.86%
jan 1, 1992
1.03
+0.015
1.49%
jan 1, 1993
1.039
+0.009
0.85%
jan 1, 1994
1.023
-0.016
-1.54%
jan 1, 1995
1.634
+0.611
59.72%
jan 1, 1996
9.173
+7.539
461.34%
jan 1, 1997
10.348
+1.175
12.81%
jan 1, 1998
11.819
+1.47
14.21%
jan 1, 1999
15.197
+3.379
28.59%
jan 1, 2000
7.016
-8.181
-53.83%
jan 1, 2001
3.25
-3.767
-53.68%
jan 1, 2002
4.54
+1.29
39.7%
jan 1, 2003
6.269
+1.729
38.1%
jan 1, 2004
10.297
+4.028
64.24%
jan 1, 2005
9.881
-0.416
-4.04%
jan 1, 2006
7.943
-1.938
-19.61%
jan 1, 2007
9.921
+1.978
24.91%
jan 1, 2008
13.218
+3.296
33.23%
jan 1, 2009
8.996
-4.222
-31.94%
jan 1, 2010
7.881
-1.114
-12.39%
jan 1, 2011
12.474
+4.593
58.27%
jan 1, 2012
18.212
+5.738
46.0%
jan 1, 2013
17.098
-1.114
-6.12%
jan 1, 2014
13.954
-3.144
-18.39%
jan 1, 2015
19.842
+5.888
42.19%
Ranking of countries by current statistics by years


Comments: