29
/
en
AIzaSyAYiBZKx7MnpbEhh9jyipgxe19OcubqV5w
April 1, 2024
188086
Malaysia
MYS
true
2
1
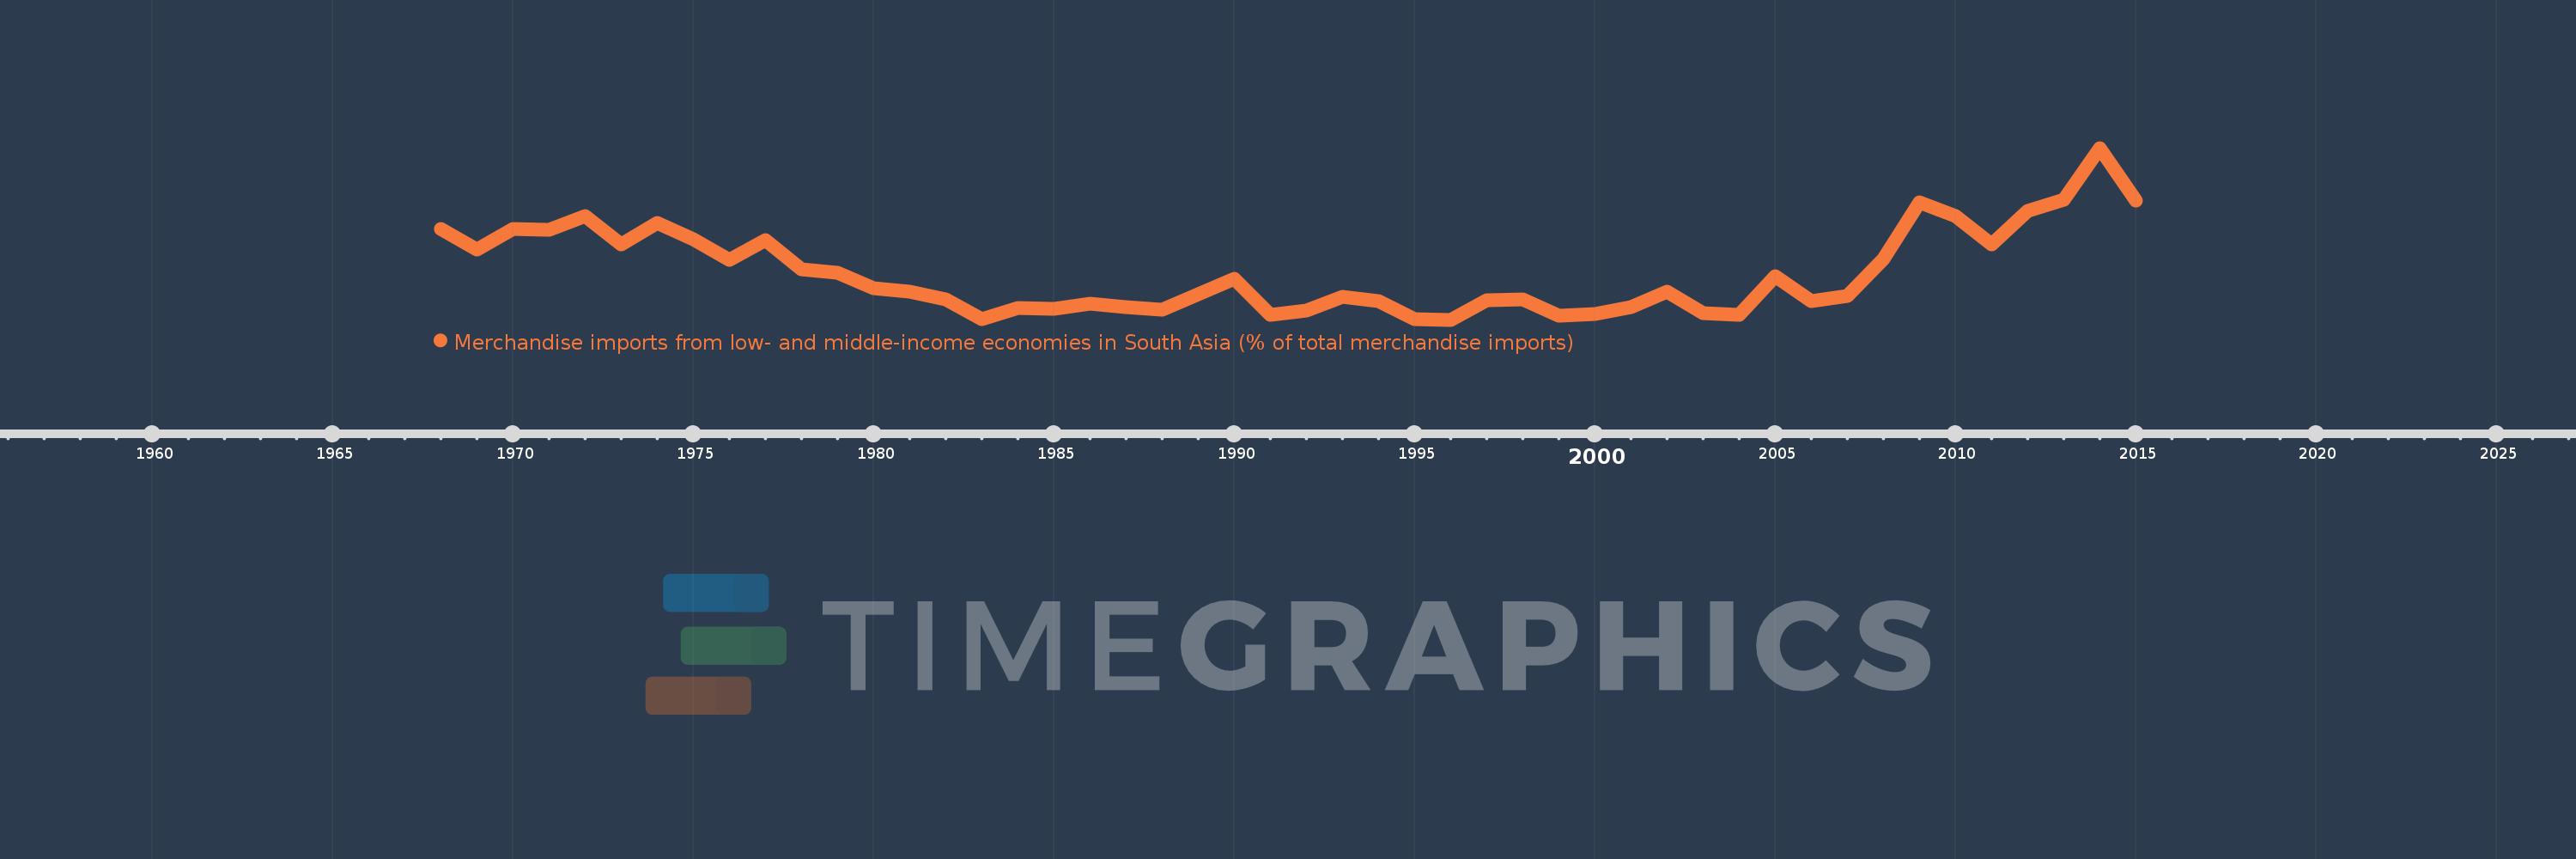
Merchandise imports from low- and middle-income economies in South Asia (% of total merchandise imports)
2015,2014,2013,2012,2011,2010,2009,2008,2007,2006,2005,2004,2003,2002,2001,2000,1999,1998,1997,1996,1995,1994,1993,1992,1991,1990,1989,1988,1987,1986,1985,1984,1983,1982,1981,1980,1979,1978,1977,1976,1975,1974,1973,1972,1971,1970,1969,1968
This statistics in other country:
AfghanistanAlbaniaAlgeriaAngolaAntigua and BarbudaArab WorldArgentinaArmeniaArubaAustraliaAustriaAzerbaijanBahamas, TheBahrainBangladeshBarbadosBelarusBelgiumBelizeBeninBermudaBoliviaBrazilBrunei DarussalamBulgariaBurkina FasoBurundiCabo VerdeCambodiaCameroonCanadaCaribbean small statesCentral African RepublicCentral Europe and the BalticsChadChileChinaColombiaCongo, Dem. Rep.Congo, Rep.Costa RicaCote d'IvoireCroatiaCubaCyprusCzech RepublicDenmarkDjiboutiDominicaDominican RepublicEarly-demographic dividendEast Asia & PacificEast Asia & Pacific (excluding high income)East Asia & Pacific (IDA & IBRD countries)EcuadorEgypt, Arab Rep.El SalvadorEstoniaEthiopiaEuro areaEurope & Central AsiaEurope & Central Asia (excluding high income)Europe & Central Asia (IDA & IBRD countries)European UnionFaroe IslandsFijiFinlandFragile and conflict affected situationsFranceGabonGambia, TheGeorgiaGermanyGhanaGibraltarGreeceGreenlandGrenadaGuatemalaGuineaGuyanaHaitiHeavily indebted poor countries (HIPC)High incomeHondurasHong Kong SAR, ChinaHungaryIBRD onlyIcelandIDA & IBRD totalIDA blendIDA onlyIDA totalIndiaIndonesiaIran, Islamic Rep.IraqIrelandIsraelItalyJamaicaJapanJordanKazakhstanKenyaKiribatiKorea, Dem. People’s Rep.Korea, Rep.KosovoKuwaitKyrgyz RepublicLao PDRLate-demographic dividendLatin America & Caribbean Latin America & Caribbean (excluding high income)Latin America & the Caribbean (IDA & IBRD countries)LatviaLeast developed countries: UN classificationLebanonLiberiaLibyaLithuaniaLow & middle incomeLow incomeLower middle incomeLuxembourgMacao SAR, ChinaMacedonia, FYRMadagascarMalawiMalaysiaMaldivesMaliMaltaMauritaniaMauritiusMexicoMiddle East & North AfricaMiddle East & North Africa (excluding high income)Middle East & North Africa (IDA & IBRD countries)Middle incomeMoldovaMongoliaMontenegroMoroccoMozambiqueMyanmarNauruNepalNetherlandsNew CaledoniaNew ZealandNicaraguaNigerNigeriaNorth AmericaNorwayOECD membersOmanOther small statesPacific island small statesPakistanPanamaPapua New GuineaParaguayPeruPhilippinesPolandPortugalPost-demographic dividendPre-demographic dividendQatarRomaniaRussian FederationRwandaSamoaSaudi ArabiaSenegalSerbiaSeychellesSierra LeoneSingaporeSlovak RepublicSloveniaSmall statesSolomon IslandsSomaliaSouth AfricaSouth AsiaSouth Asia (IDA & IBRD)SpainSri LankaSt. Kitts and NevisSt. LuciaSt. Vincent and the GrenadinesSub-Saharan Africa Sub-Saharan Africa (excluding high income)Sub-Saharan Africa (IDA & IBRD countries)SudanSurinameSwedenSwitzerlandSyrian Arab RepublicTajikistanTanzaniaThailandTogoTongaTrinidad and TobagoTunisiaTurkeyTurkmenistanUgandaUkraineUnited Arab EmiratesUnited KingdomUnited StatesUpper middle incomeUruguayUzbekistanVanuatuVenezuela, RBVietnamWorldYemen, Rep.ZambiaZimbabwe Timeline:
This timeline shows a graph from 1968 to 2015 of Malaysia. No data until 1967. Number of actual observations by date: 48.
Source name:
World Development Indicators
Source organization:
World Bank staff estimates based data from International Monetary Fund's Direction of Trade database.
Categories, topics:
Private Sector, Trade
Last updated:
apr 23, 2017
Indicators value changes by year
At the date of observation
Value
Absolute change
Change from previous value
jan 1, 1968
1.836
+1.836
0.0%
jan 1, 1969
1.612
-0.223
-12.17%
jan 1, 1970
1.834
+0.222
13.76%
jan 1, 1971
1.824
-0.01
-0.53%
jan 1, 1972
1.978
+0.154
8.43%
jan 1, 1973
1.669
-0.309
-15.63%
jan 1, 1974
1.903
+0.234
14.03%
jan 1, 1975
1.719
-0.184
-9.66%
jan 1, 1976
1.492
-0.227
-13.2%
jan 1, 1977
1.71
+0.218
14.58%
jan 1, 1978
1.395
-0.315
-18.41%
jan 1, 1979
1.351
-0.044
-3.14%
jan 1, 1980
1.182
-0.169
-12.54%
jan 1, 1981
1.147
-0.035
-2.93%
jan 1, 1982
1.065
-0.082
-7.14%
jan 1, 1983
0.845
-0.22
-20.65%
jan 1, 1984
0.969
+0.124
14.63%
jan 1, 1985
0.957
-0.012
-1.23%
jan 1, 1986
1.014
+0.057
5.98%
jan 1, 1987
0.976
-0.039
-3.81%
jan 1, 1988
0.945
-0.031
-3.2%
jan 1, 1989
1.122
+0.177
18.78%
jan 1, 1990
1.29
+0.168
14.99%
jan 1, 1991
0.894
-0.396
-30.69%
jan 1, 1992
0.943
+0.049
5.47%
jan 1, 1993
1.092
+0.149
15.81%
jan 1, 1994
1.041
-0.051
-4.67%
jan 1, 1995
0.841
-0.2
-19.24%
jan 1, 1996
0.838
-0.003
-0.37%
jan 1, 1997
1.055
+0.217
25.89%
jan 1, 1998
1.058
+0.003
0.27%
jan 1, 1999
0.878
-0.179
-16.97%
jan 1, 2000
0.902
+0.024
2.7%
jan 1, 2001
0.974
+0.072
7.97%
jan 1, 2002
1.143
+0.169
17.39%
jan 1, 2003
0.912
-0.231
-20.21%
jan 1, 2004
0.896
-0.017
-1.82%
jan 1, 2005
1.312
+0.416
46.45%
jan 1, 2006
1.047
-0.265
-20.17%
jan 1, 2007
1.102
+0.055
5.25%
jan 1, 2008
1.503
+0.401
36.37%
jan 1, 2009
2.124
+0.622
41.36%
jan 1, 2010
1.98
-0.144
-6.79%
jan 1, 2011
1.662
-0.318
-16.05%
jan 1, 2012
2.028
+0.365
21.98%
jan 1, 2013
2.153
+0.126
6.2%
jan 1, 2014
2.723
+0.57
26.45%
jan 1, 2015
2.142
-0.581
-21.34%
Ranking of countries by current statistics by years


Comments: