29
/
en
AIzaSyAYiBZKx7MnpbEhh9jyipgxe19OcubqV5w
April 1, 2024
240697
Singapore
SGP
true
2
1
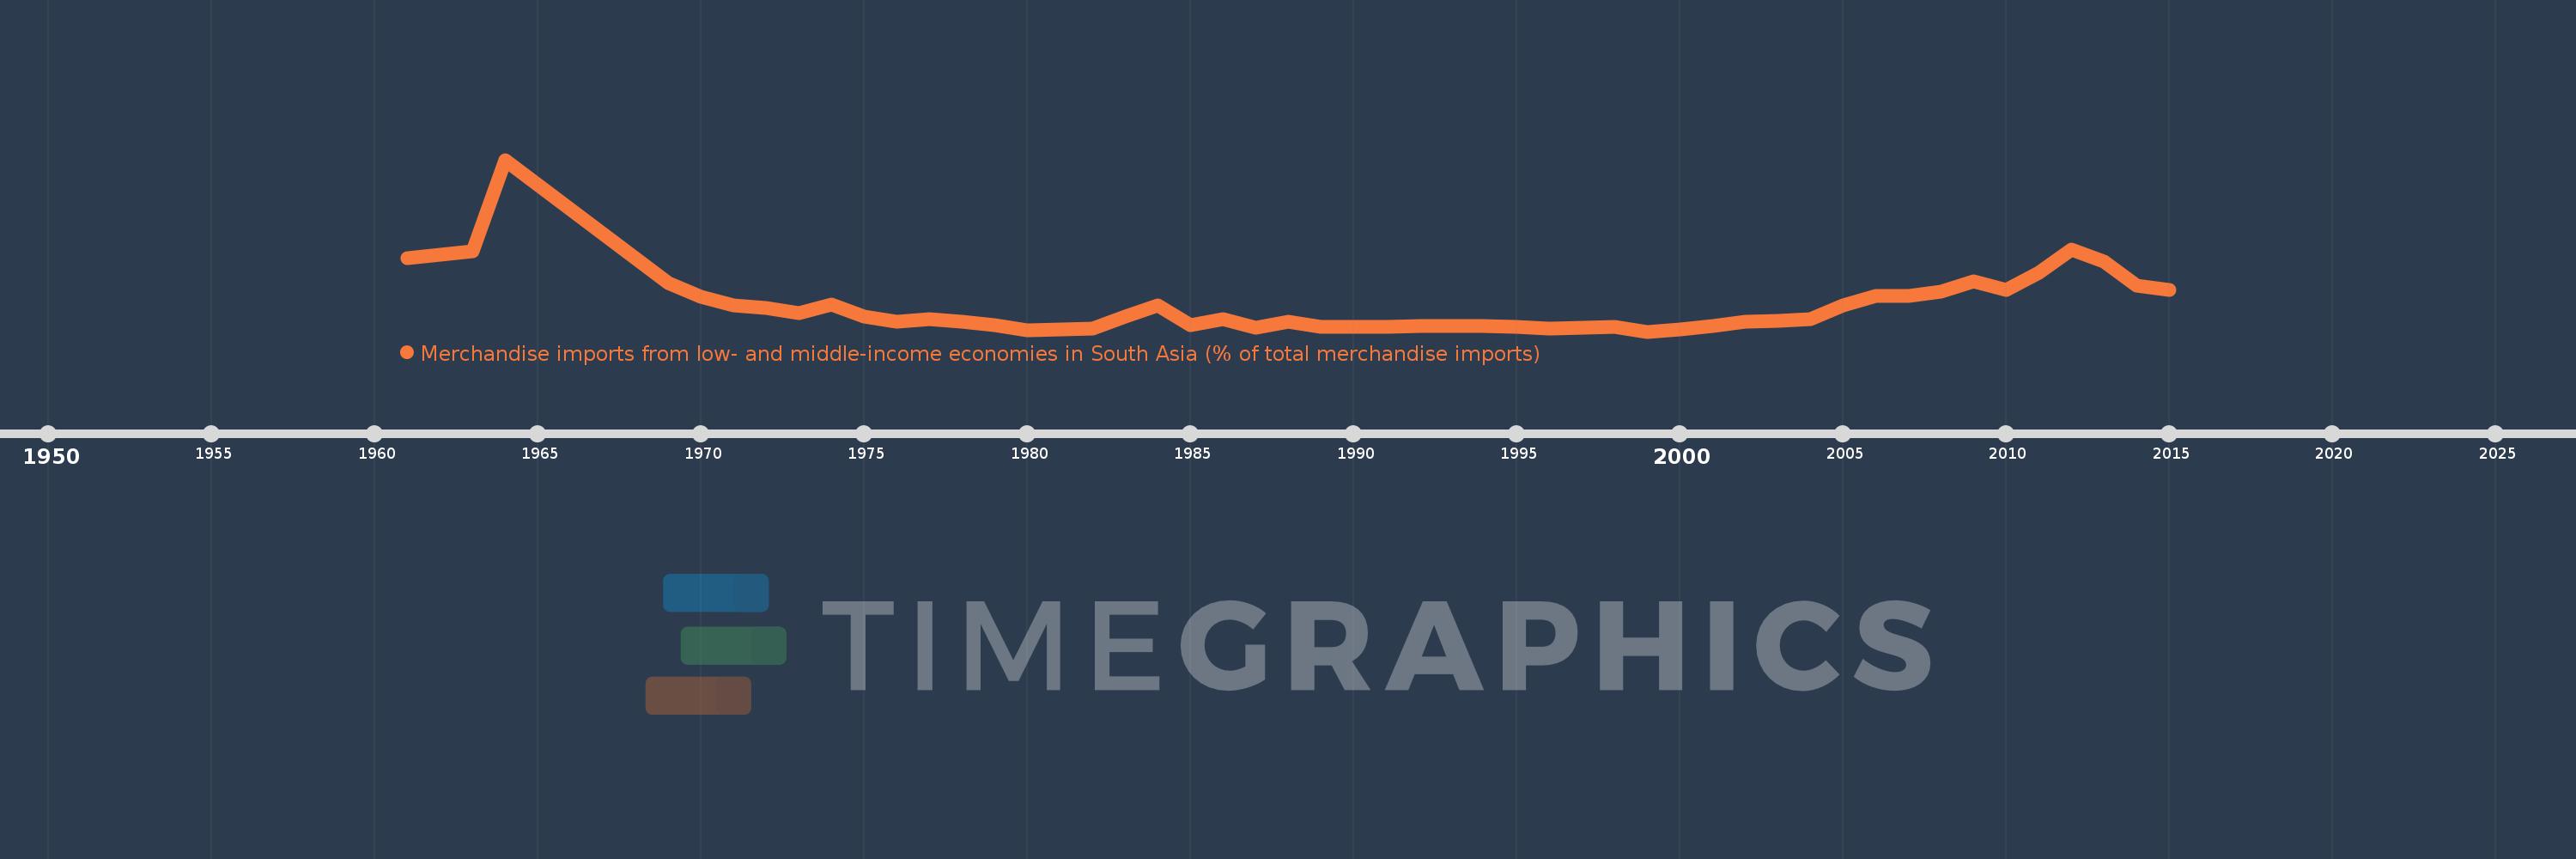
Merchandise imports from low- and middle-income economies in South Asia (% of total merchandise imports)
2015,2014,2013,2012,2011,2010,2009,2008,2007,2006,2005,2004,2003,2002,2001,2000,1999,1998,1997,1996,1995,1994,1993,1992,1991,1990,1989,1988,1987,1986,1985,1984,1983,1982,1981,1980,1979,1978,1977,1976,1975,1974,1973,1972,1971,1970,1969,1964,1963,1961
This statistics in other country:
AfghanistanAlbaniaAlgeriaAngolaAntigua and BarbudaArab WorldArgentinaArmeniaArubaAustraliaAustriaAzerbaijanBahamas, TheBahrainBangladeshBarbadosBelarusBelgiumBelizeBeninBermudaBoliviaBrazilBrunei DarussalamBulgariaBurkina FasoBurundiCabo VerdeCambodiaCameroonCanadaCaribbean small statesCentral African RepublicCentral Europe and the BalticsChadChileChinaColombiaCongo, Dem. Rep.Congo, Rep.Costa RicaCote d'IvoireCroatiaCubaCyprusCzech RepublicDenmarkDjiboutiDominicaDominican RepublicEarly-demographic dividendEast Asia & PacificEast Asia & Pacific (excluding high income)East Asia & Pacific (IDA & IBRD countries)EcuadorEgypt, Arab Rep.El SalvadorEstoniaEthiopiaEuro areaEurope & Central AsiaEurope & Central Asia (excluding high income)Europe & Central Asia (IDA & IBRD countries)European UnionFaroe IslandsFijiFinlandFragile and conflict affected situationsFranceGabonGambia, TheGeorgiaGermanyGhanaGibraltarGreeceGreenlandGrenadaGuatemalaGuineaGuyanaHaitiHeavily indebted poor countries (HIPC)High incomeHondurasHong Kong SAR, ChinaHungaryIBRD onlyIcelandIDA & IBRD totalIDA blendIDA onlyIDA totalIndiaIndonesiaIran, Islamic Rep.IraqIrelandIsraelItalyJamaicaJapanJordanKazakhstanKenyaKiribatiKorea, Dem. People’s Rep.Korea, Rep.KosovoKuwaitKyrgyz RepublicLao PDRLate-demographic dividendLatin America & Caribbean Latin America & Caribbean (excluding high income)Latin America & the Caribbean (IDA & IBRD countries)LatviaLeast developed countries: UN classificationLebanonLiberiaLibyaLithuaniaLow & middle incomeLow incomeLower middle incomeLuxembourgMacao SAR, ChinaMacedonia, FYRMadagascarMalawiMalaysiaMaldivesMaliMaltaMauritaniaMauritiusMexicoMiddle East & North AfricaMiddle East & North Africa (excluding high income)Middle East & North Africa (IDA & IBRD countries)Middle incomeMoldovaMongoliaMontenegroMoroccoMozambiqueMyanmarNauruNepalNetherlandsNew CaledoniaNew ZealandNicaraguaNigerNigeriaNorth AmericaNorwayOECD membersOmanOther small statesPacific island small statesPakistanPanamaPapua New GuineaParaguayPeruPhilippinesPolandPortugalPost-demographic dividendPre-demographic dividendQatarRomaniaRussian FederationRwandaSamoaSaudi ArabiaSenegalSerbiaSeychellesSierra LeoneSingaporeSlovak RepublicSloveniaSmall statesSolomon IslandsSomaliaSouth AfricaSouth AsiaSouth Asia (IDA & IBRD)SpainSri LankaSt. Kitts and NevisSt. LuciaSt. Vincent and the GrenadinesSub-Saharan Africa Sub-Saharan Africa (excluding high income)Sub-Saharan Africa (IDA & IBRD countries)SudanSurinameSwedenSwitzerlandSyrian Arab RepublicTajikistanTanzaniaThailandTogoTongaTrinidad and TobagoTunisiaTurkeyTurkmenistanUgandaUkraineUnited Arab EmiratesUnited KingdomUnited StatesUpper middle incomeUruguayUzbekistanVanuatuVenezuela, RBVietnamWorldYemen, Rep.ZambiaZimbabwe Timeline:
This timeline shows a graph from 1961 to 2015 of Singapore. No data until 1960. Number of actual observations by date: 50.
Source name:
World Development Indicators
Source organization:
World Bank staff estimates based data from International Monetary Fund's Direction of Trade database.
Categories, topics:
Private Sector, Trade
Last updated:
apr 23, 2017
Indicators value changes by year
At the date of observation
Value
Absolute change
Change from previous value
jan 1, 1961
3.621
+3.621
0.0%
jan 1, 1963
3.903
+0.281
7.77%
jan 1, 1964
7.488
+3.585
91.87%
jan 1, 1969
2.643
-4.845
-64.71%
jan 1, 1970
2.108
-0.535
-20.24%
jan 1, 1971
1.747
-0.361
-17.13%
jan 1, 1972
1.645
-0.102
-5.83%
jan 1, 1973
1.443
-0.202
-12.29%
jan 1, 1974
1.807
+0.364
25.23%
jan 1, 1975
1.321
-0.486
-26.89%
jan 1, 1976
1.125
-0.196
-14.82%
jan 1, 1977
1.215
+0.09
7.97%
jan 1, 1978
1.13
-0.085
-6.97%
jan 1, 1979
0.974
-0.156
-13.78%
jan 1, 1980
0.784
-0.19
-19.51%
jan 1, 1981
0.828
+0.044
5.63%
jan 1, 1982
0.856
+0.028
3.38%
jan 1, 1983
1.308
+0.451
52.69%
jan 1, 1984
1.753
+0.445
34.03%
jan 1, 1985
1.0
-0.752
-42.93%
jan 1, 1986
1.215
+0.215
21.47%
jan 1, 1987
0.896
-0.319
-26.23%
jan 1, 1988
1.118
+0.222
24.74%
jan 1, 1989
0.916
-0.202
-18.05%
jan 1, 1990
0.91
-0.006
-0.7%
jan 1, 1991
0.903
-0.007
-0.74%
jan 1, 1992
0.967
+0.064
7.11%
jan 1, 1993
0.942
-0.025
-2.62%
jan 1, 1994
0.96
+0.018
1.93%
jan 1, 1995
0.926
-0.034
-3.52%
jan 1, 1996
0.859
-0.068
-7.32%
jan 1, 1997
0.899
+0.04
4.71%
jan 1, 1998
0.921
+0.021
2.39%
jan 1, 1999
0.731
-0.189
-20.58%
jan 1, 2000
0.809
+0.078
10.68%
jan 1, 2001
0.948
+0.139
17.17%
jan 1, 2002
1.103
+0.155
16.36%
jan 1, 2003
1.154
+0.051
4.6%
jan 1, 2004
1.213
+0.059
5.09%
jan 1, 2005
1.765
+0.552
45.5%
jan 1, 2006
2.136
+0.372
21.06%
jan 1, 2007
2.138
+0.002
0.1%
jan 1, 2008
2.311
+0.173
8.09%
jan 1, 2009
2.722
+0.411
17.78%
jan 1, 2010
2.365
-0.357
-13.12%
jan 1, 2011
3.048
+0.683
28.86%
jan 1, 2012
3.953
+0.906
29.71%
jan 1, 2013
3.481
-0.472
-11.95%
jan 1, 2014
2.549
-0.932
-26.78%
jan 1, 2015
2.378
-0.171
-6.72%
Ranking of countries by current statistics by years


Comments: