29
/
en
AIzaSyAYiBZKx7MnpbEhh9jyipgxe19OcubqV5w
April 1, 2024
280047
Vanuatu
VUT
true
2
1
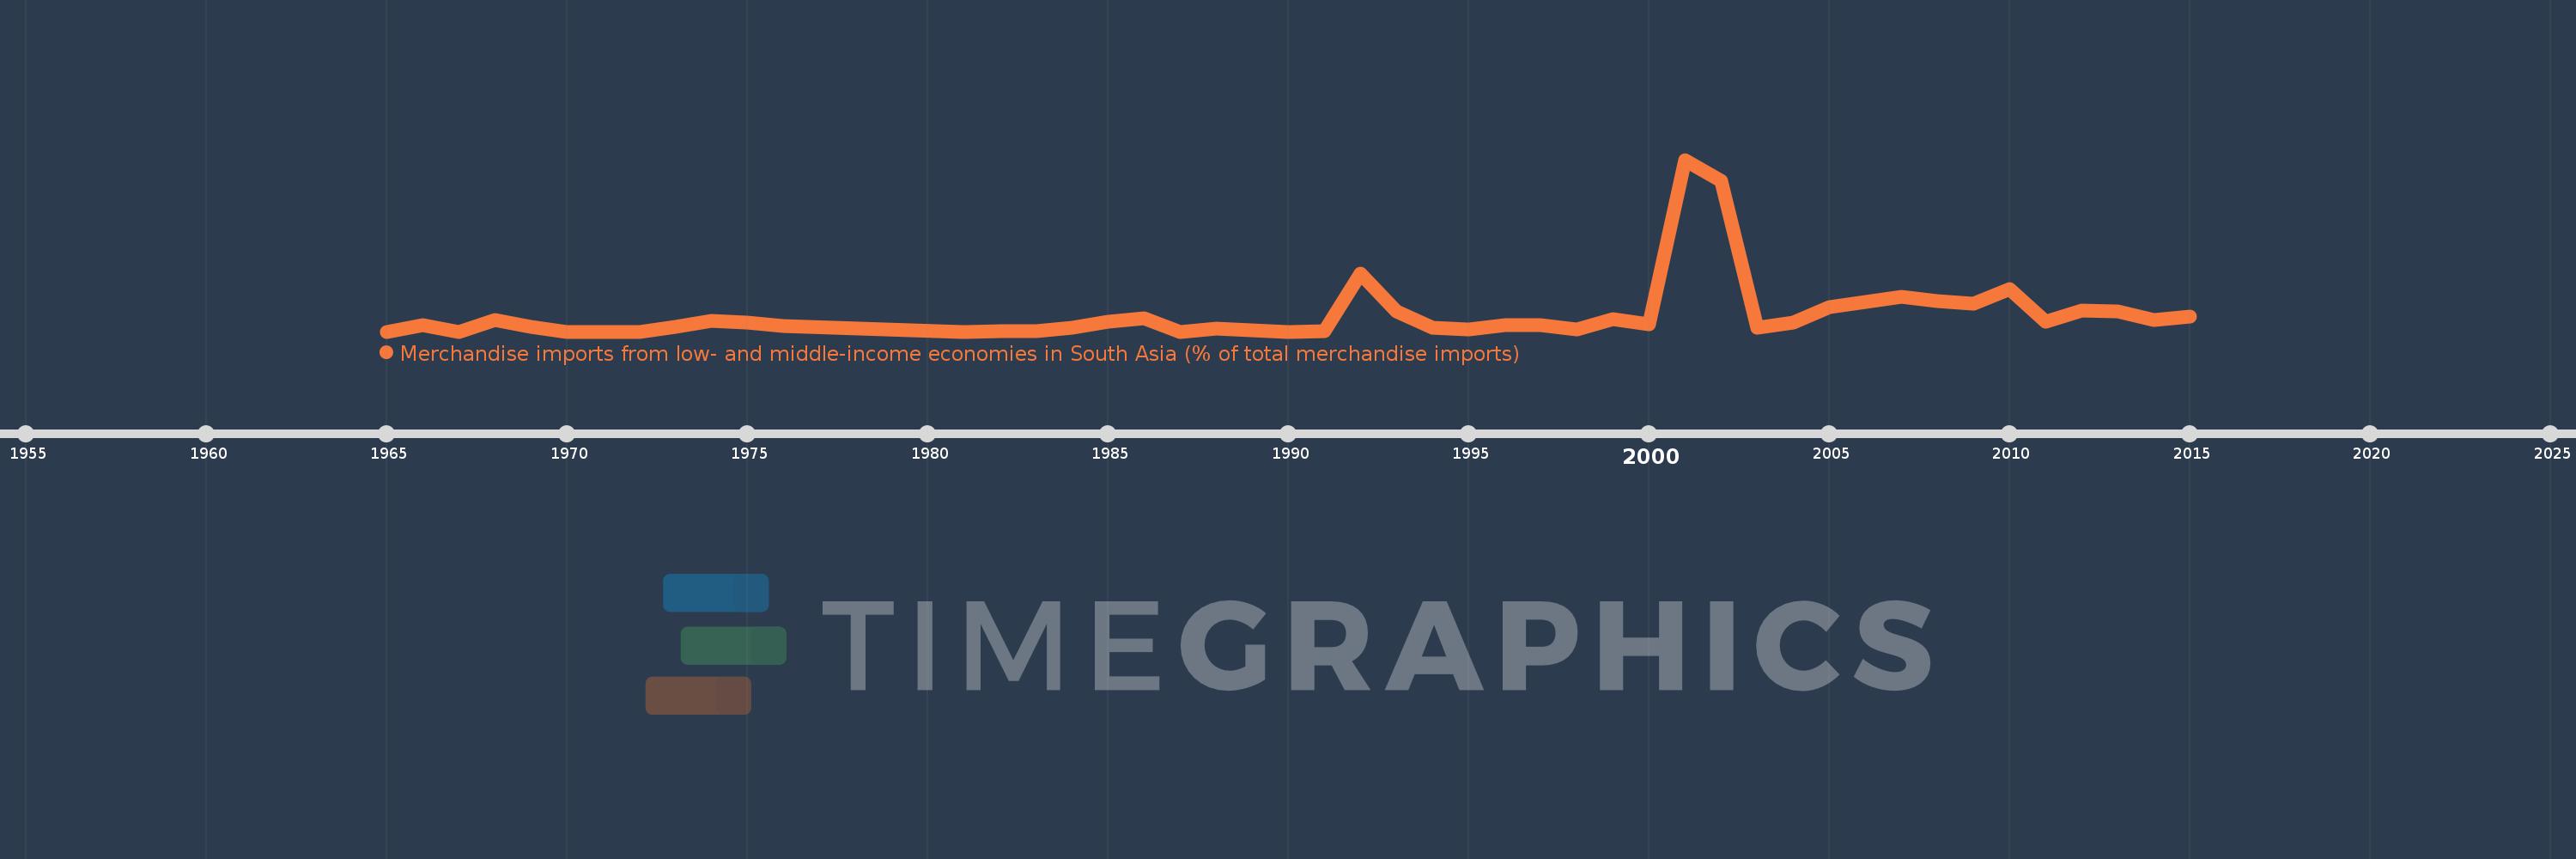
Merchandise imports from low- and middle-income economies in South Asia (% of total merchandise imports)
2015,2014,2013,2012,2011,2010,2009,2008,2007,2006,2005,2004,2003,2002,2001,2000,1999,1998,1997,1996,1995,1994,1993,1992,1991,1990,1989,1988,1987,1986,1985,1984,1983,1982,1981,1976,1975,1974,1973,1972,1971,1970,1969,1968,1967,1966,1965
This statistics in other country:
AfghanistanAlbaniaAlgeriaAngolaAntigua and BarbudaArab WorldArgentinaArmeniaArubaAustraliaAustriaAzerbaijanBahamas, TheBahrainBangladeshBarbadosBelarusBelgiumBelizeBeninBermudaBoliviaBrazilBrunei DarussalamBulgariaBurkina FasoBurundiCabo VerdeCambodiaCameroonCanadaCaribbean small statesCentral African RepublicCentral Europe and the BalticsChadChileChinaColombiaCongo, Dem. Rep.Congo, Rep.Costa RicaCote d'IvoireCroatiaCubaCyprusCzech RepublicDenmarkDjiboutiDominicaDominican RepublicEarly-demographic dividendEast Asia & PacificEast Asia & Pacific (excluding high income)East Asia & Pacific (IDA & IBRD countries)EcuadorEgypt, Arab Rep.El SalvadorEstoniaEthiopiaEuro areaEurope & Central AsiaEurope & Central Asia (excluding high income)Europe & Central Asia (IDA & IBRD countries)European UnionFaroe IslandsFijiFinlandFragile and conflict affected situationsFranceGabonGambia, TheGeorgiaGermanyGhanaGibraltarGreeceGreenlandGrenadaGuatemalaGuineaGuyanaHaitiHeavily indebted poor countries (HIPC)High incomeHondurasHong Kong SAR, ChinaHungaryIBRD onlyIcelandIDA & IBRD totalIDA blendIDA onlyIDA totalIndiaIndonesiaIran, Islamic Rep.IraqIrelandIsraelItalyJamaicaJapanJordanKazakhstanKenyaKiribatiKorea, Dem. People’s Rep.Korea, Rep.KosovoKuwaitKyrgyz RepublicLao PDRLate-demographic dividendLatin America & Caribbean Latin America & Caribbean (excluding high income)Latin America & the Caribbean (IDA & IBRD countries)LatviaLeast developed countries: UN classificationLebanonLiberiaLibyaLithuaniaLow & middle incomeLow incomeLower middle incomeLuxembourgMacao SAR, ChinaMacedonia, FYRMadagascarMalawiMalaysiaMaldivesMaliMaltaMauritaniaMauritiusMexicoMiddle East & North AfricaMiddle East & North Africa (excluding high income)Middle East & North Africa (IDA & IBRD countries)Middle incomeMoldovaMongoliaMontenegroMoroccoMozambiqueMyanmarNauruNepalNetherlandsNew CaledoniaNew ZealandNicaraguaNigerNigeriaNorth AmericaNorwayOECD membersOmanOther small statesPacific island small statesPakistanPanamaPapua New GuineaParaguayPeruPhilippinesPolandPortugalPost-demographic dividendPre-demographic dividendQatarRomaniaRussian FederationRwandaSamoaSaudi ArabiaSenegalSerbiaSeychellesSierra LeoneSingaporeSlovak RepublicSloveniaSmall statesSolomon IslandsSomaliaSouth AfricaSouth AsiaSouth Asia (IDA & IBRD)SpainSri LankaSt. Kitts and NevisSt. LuciaSt. Vincent and the GrenadinesSub-Saharan Africa Sub-Saharan Africa (excluding high income)Sub-Saharan Africa (IDA & IBRD countries)SudanSurinameSwedenSwitzerlandSyrian Arab RepublicTajikistanTanzaniaThailandTogoTongaTrinidad and TobagoTunisiaTurkeyTurkmenistanUgandaUkraineUnited Arab EmiratesUnited KingdomUnited StatesUpper middle incomeUruguayUzbekistanVanuatuVenezuela, RBVietnamWorldYemen, Rep.ZambiaZimbabwe Timeline:
This timeline shows a graph from 1965 to 2015 of Vanuatu. No data until 1964. Number of actual observations by date: 47.
Source name:
World Development Indicators
Source organization:
World Bank staff estimates based data from International Monetary Fund's Direction of Trade database.
Categories, topics:
Private Sector, Trade
Last updated:
apr 23, 2017
Indicators value changes by year
At the date of observation
Value
Absolute change
Change from previous value
jan 1, 1966
0.157
+0.157
%
jan 1, 1967
0.0
-0.157
-100.0%
jan 1, 1968
0.291
+0.291
%
jan 1, 1969
0.128
-0.162
-55.78%
jan 1, 1970
0.0
-0.128
-100.0%
jan 1, 1973
0.123
+0.123
%
jan 1, 1974
0.28
+0.156
126.56%
jan 1, 1975
0.224
-0.055
-19.77%
jan 1, 1976
0.14
-0.085
-37.76%
jan 1, 1981
0.0
-0.14
-100.0%
jan 1, 1982
0.019
+0.019
%
jan 1, 1983
0.017
-0.002
-10.1%
jan 1, 1984
0.094
+0.077
452.07%
jan 1, 1985
0.257
+0.164
174.42%
jan 1, 1986
0.345
+0.087
33.85%
jan 1, 1987
0.0
-0.345
-100.0%
jan 1, 1988
0.081
+0.081
%
jan 1, 1989
0.042
-0.038
-47.28%
jan 1, 1990
0.0
-0.042
-100.0%
jan 1, 1991
0.017
+0.017
%
jan 1, 1992
1.506
+1.489
9.0K%
jan 1, 1993
0.525
-0.981
-65.15%
jan 1, 1994
0.092
-0.433
-82.56%
jan 1, 1995
0.046
-0.046
-49.86%
jan 1, 1996
0.168
+0.122
266.81%
jan 1, 1997
0.164
-0.004
-2.41%
jan 1, 1998
0.051
-0.113
-68.93%
jan 1, 1999
0.319
+0.268
525.65%
jan 1, 2000
0.187
-0.132
-41.48%
jan 1, 2001
4.438
+4.251
2.27K%
jan 1, 2002
3.894
-0.543
-12.24%
jan 1, 2003
0.109
-3.785
-97.2%
jan 1, 2004
0.226
+0.117
106.81%
jan 1, 2005
0.641
+0.415
183.9%
jan 1, 2006
0.763
+0.122
19.03%
jan 1, 2007
0.902
+0.139
18.21%
jan 1, 2008
0.792
-0.11
-12.19%
jan 1, 2009
0.724
-0.068
-8.64%
jan 1, 2010
1.09
+0.366
50.59%
jan 1, 2011
0.247
-0.843
-77.36%
jan 1, 2012
0.545
+0.298
120.81%
jan 1, 2013
0.528
-0.017
-3.03%
jan 1, 2014
0.291
-0.237
-44.84%
jan 1, 2015
0.396
+0.105
36.04%
Ranking of countries by current statistics by years


Comments: