29
/
en
AIzaSyAYiBZKx7MnpbEhh9jyipgxe19OcubqV5w
April 1, 2024
214574
Norway
NOR
true
2
1
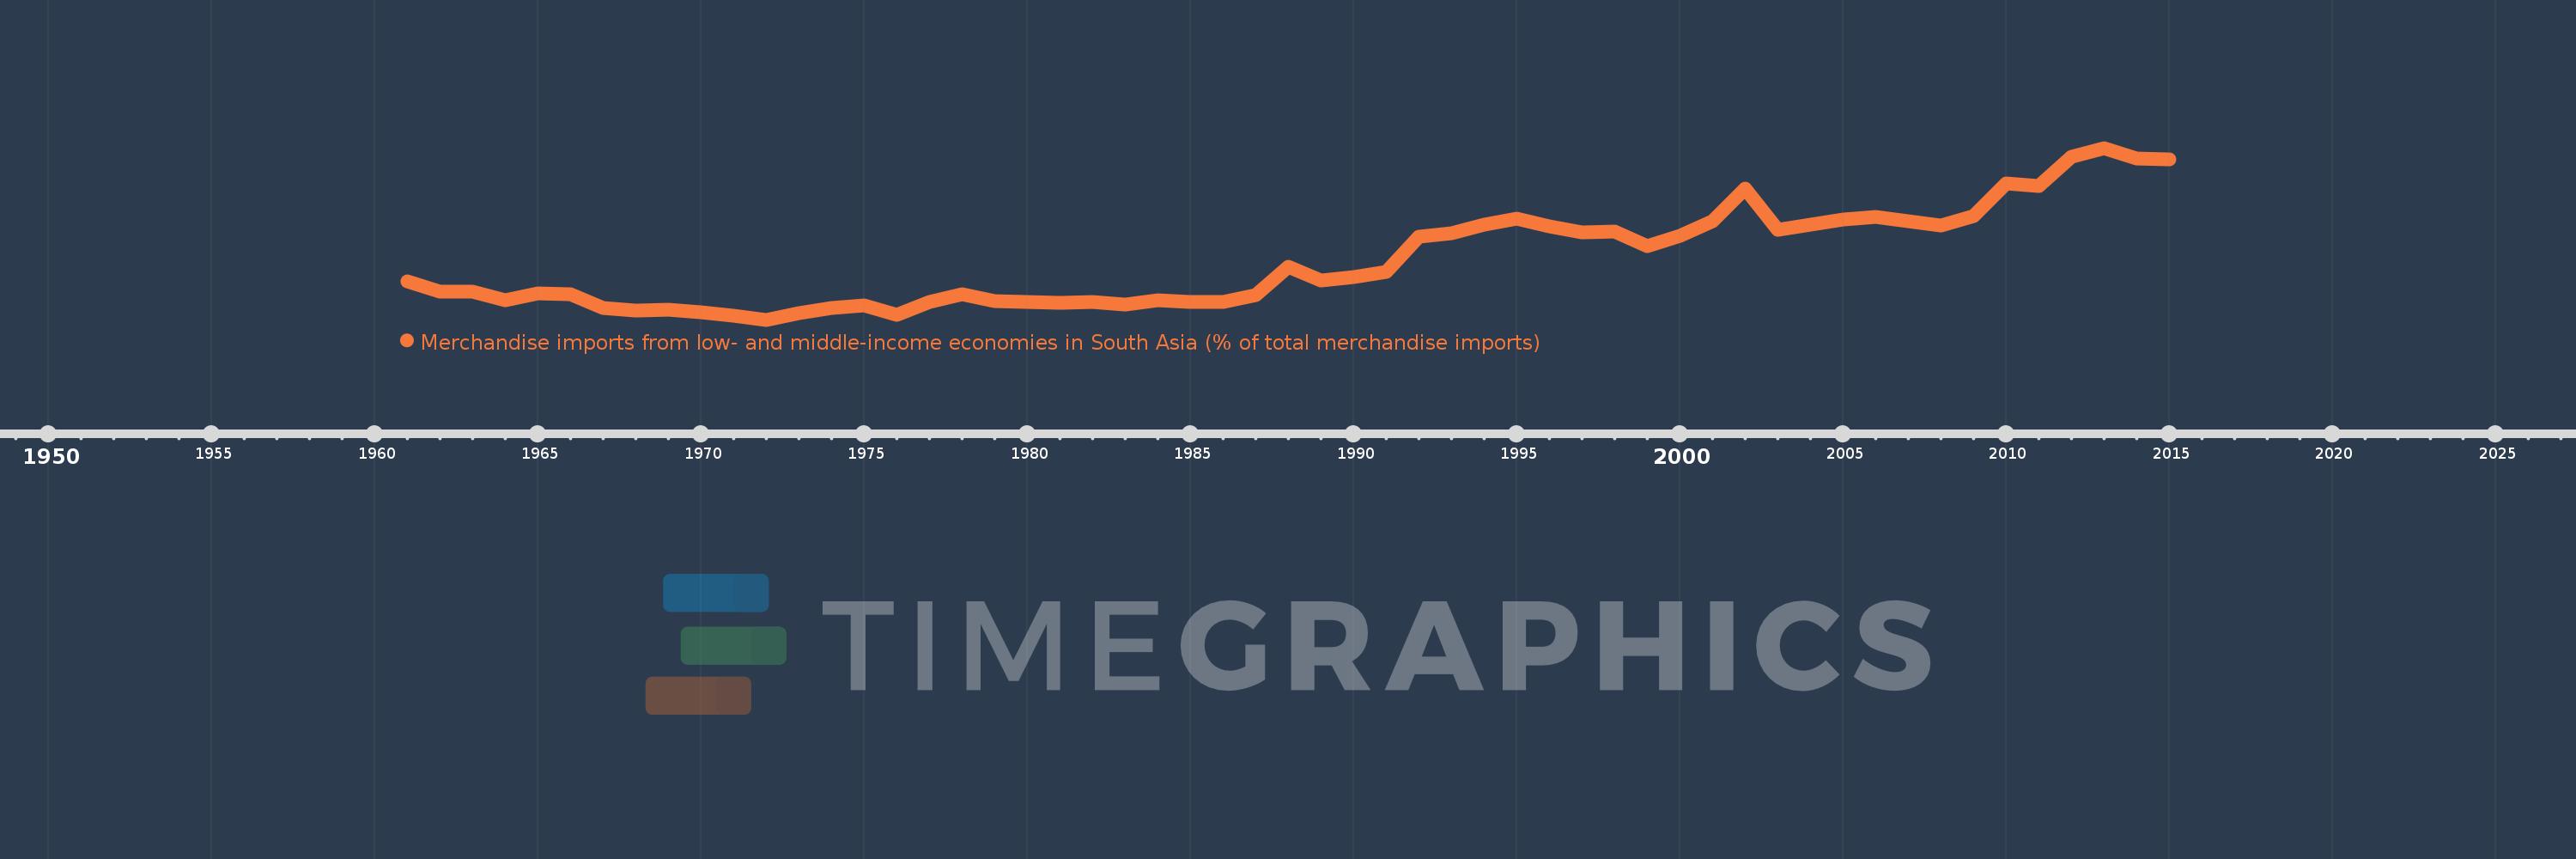
Merchandise imports from low- and middle-income economies in South Asia (% of total merchandise imports)
2015,2014,2013,2012,2011,2010,2009,2008,2007,2006,2005,2004,2003,2002,2001,2000,1999,1998,1997,1996,1995,1994,1993,1992,1991,1990,1989,1988,1987,1986,1985,1984,1983,1982,1981,1980,1979,1978,1977,1976,1975,1974,1973,1972,1971,1970,1969,1968,1967,1966,1965,1964,1963,1962,1961
This statistics in other country:
AfghanistanAlbaniaAlgeriaAngolaAntigua and BarbudaArab WorldArgentinaArmeniaArubaAustraliaAustriaAzerbaijanBahamas, TheBahrainBangladeshBarbadosBelarusBelgiumBelizeBeninBermudaBoliviaBrazilBrunei DarussalamBulgariaBurkina FasoBurundiCabo VerdeCambodiaCameroonCanadaCaribbean small statesCentral African RepublicCentral Europe and the BalticsChadChileChinaColombiaCongo, Dem. Rep.Congo, Rep.Costa RicaCote d'IvoireCroatiaCubaCyprusCzech RepublicDenmarkDjiboutiDominicaDominican RepublicEarly-demographic dividendEast Asia & PacificEast Asia & Pacific (excluding high income)East Asia & Pacific (IDA & IBRD countries)EcuadorEgypt, Arab Rep.El SalvadorEstoniaEthiopiaEuro areaEurope & Central AsiaEurope & Central Asia (excluding high income)Europe & Central Asia (IDA & IBRD countries)European UnionFaroe IslandsFijiFinlandFragile and conflict affected situationsFranceGabonGambia, TheGeorgiaGermanyGhanaGibraltarGreeceGreenlandGrenadaGuatemalaGuineaGuyanaHaitiHeavily indebted poor countries (HIPC)High incomeHondurasHong Kong SAR, ChinaHungaryIBRD onlyIcelandIDA & IBRD totalIDA blendIDA onlyIDA totalIndiaIndonesiaIran, Islamic Rep.IraqIrelandIsraelItalyJamaicaJapanJordanKazakhstanKenyaKiribatiKorea, Dem. People’s Rep.Korea, Rep.KosovoKuwaitKyrgyz RepublicLao PDRLate-demographic dividendLatin America & Caribbean Latin America & Caribbean (excluding high income)Latin America & the Caribbean (IDA & IBRD countries)LatviaLeast developed countries: UN classificationLebanonLiberiaLibyaLithuaniaLow & middle incomeLow incomeLower middle incomeLuxembourgMacao SAR, ChinaMacedonia, FYRMadagascarMalawiMalaysiaMaldivesMaliMaltaMauritaniaMauritiusMexicoMiddle East & North AfricaMiddle East & North Africa (excluding high income)Middle East & North Africa (IDA & IBRD countries)Middle incomeMoldovaMongoliaMontenegroMoroccoMozambiqueMyanmarNauruNepalNetherlandsNew CaledoniaNew ZealandNicaraguaNigerNigeriaNorth AmericaNorwayOECD membersOmanOther small statesPacific island small statesPakistanPanamaPapua New GuineaParaguayPeruPhilippinesPolandPortugalPost-demographic dividendPre-demographic dividendQatarRomaniaRussian FederationRwandaSamoaSaudi ArabiaSenegalSerbiaSeychellesSierra LeoneSingaporeSlovak RepublicSloveniaSmall statesSolomon IslandsSomaliaSouth AfricaSouth AsiaSouth Asia (IDA & IBRD)SpainSri LankaSt. Kitts and NevisSt. LuciaSt. Vincent and the GrenadinesSub-Saharan Africa Sub-Saharan Africa (excluding high income)Sub-Saharan Africa (IDA & IBRD countries)SudanSurinameSwedenSwitzerlandSyrian Arab RepublicTajikistanTanzaniaThailandTogoTongaTrinidad and TobagoTunisiaTurkeyTurkmenistanUgandaUkraineUnited Arab EmiratesUnited KingdomUnited StatesUpper middle incomeUruguayUzbekistanVanuatuVenezuela, RBVietnamWorldYemen, Rep.ZambiaZimbabwe Timeline:
This timeline shows a graph from 1961 to 2015 of Norway. No data until 1960. Number of actual observations by date: 55.
Source name:
World Development Indicators
Source organization:
World Bank staff estimates based data from International Monetary Fund's Direction of Trade database.
Categories, topics:
Private Sector, Trade
Last updated:
apr 23, 2017
Indicators value changes by year
At the date of observation
Value
Absolute change
Change from previous value
jan 1, 1961
0.296
+0.296
0.0%
jan 1, 1962
0.242
-0.053
-18.03%
jan 1, 1963
0.242
0.0
-0.03%
jan 1, 1964
0.198
-0.044
-18.22%
jan 1, 1965
0.237
+0.039
19.75%
jan 1, 1966
0.231
-0.006
-2.49%
jan 1, 1967
0.162
-0.069
-29.86%
jan 1, 1968
0.149
-0.013
-8.04%
jan 1, 1969
0.152
+0.002
1.51%
jan 1, 1970
0.138
-0.014
-9.2%
jan 1, 1971
0.122
-0.016
-11.37%
jan 1, 1972
0.1
-0.022
-17.87%
jan 1, 1973
0.133
+0.033
33.23%
jan 1, 1974
0.159
+0.026
19.2%
jan 1, 1975
0.172
+0.013
8.09%
jan 1, 1976
0.127
-0.045
-26.3%
jan 1, 1977
0.191
+0.064
50.73%
jan 1, 1978
0.231
+0.04
20.93%
jan 1, 1979
0.194
-0.037
-16.08%
jan 1, 1980
0.19
-0.004
-2.09%
jan 1, 1981
0.185
-0.005
-2.61%
jan 1, 1982
0.189
+0.004
2.43%
jan 1, 1983
0.177
-0.012
-6.31%
jan 1, 1984
0.198
+0.02
11.42%
jan 1, 1985
0.191
-0.006
-3.19%
jan 1, 1986
0.189
-0.002
-1.06%
jan 1, 1987
0.225
+0.036
18.96%
jan 1, 1988
0.373
+0.148
65.71%
jan 1, 1989
0.299
-0.074
-19.77%
jan 1, 1990
0.32
+0.021
7.0%
jan 1, 1991
0.343
+0.023
7.03%
jan 1, 1992
0.525
+0.182
53.02%
jan 1, 1993
0.542
+0.018
3.38%
jan 1, 1994
0.586
+0.043
8.0%
jan 1, 1995
0.616
+0.03
5.13%
jan 1, 1996
0.577
-0.039
-6.3%
jan 1, 1997
0.545
-0.032
-5.59%
jan 1, 1998
0.553
+0.008
1.47%
jan 1, 1999
0.476
-0.077
-13.9%
jan 1, 2000
0.531
+0.055
11.49%
jan 1, 2001
0.602
+0.072
13.51%
jan 1, 2002
0.77
+0.167
27.74%
jan 1, 2003
0.562
-0.207
-26.95%
jan 1, 2004
0.588
+0.026
4.67%
jan 1, 2005
0.613
+0.025
4.22%
jan 1, 2006
0.626
+0.012
2.04%
jan 1, 2007
0.604
-0.021
-3.43%
jan 1, 2008
0.583
-0.021
-3.47%
jan 1, 2009
0.63
+0.047
8.07%
jan 1, 2010
0.798
+0.168
26.57%
jan 1, 2011
0.786
-0.012
-1.45%
jan 1, 2012
0.935
+0.148
18.87%
jan 1, 2013
0.979
+0.044
4.73%
jan 1, 2014
0.927
-0.052
-5.32%
jan 1, 2015
0.92
-0.007
-0.73%
Ranking of countries by current statistics by years


Comments: