29
/
en
AIzaSyAYiBZKx7MnpbEhh9jyipgxe19OcubqV5w
April 1, 2024
253297
Sudan
SDN
true
2
1
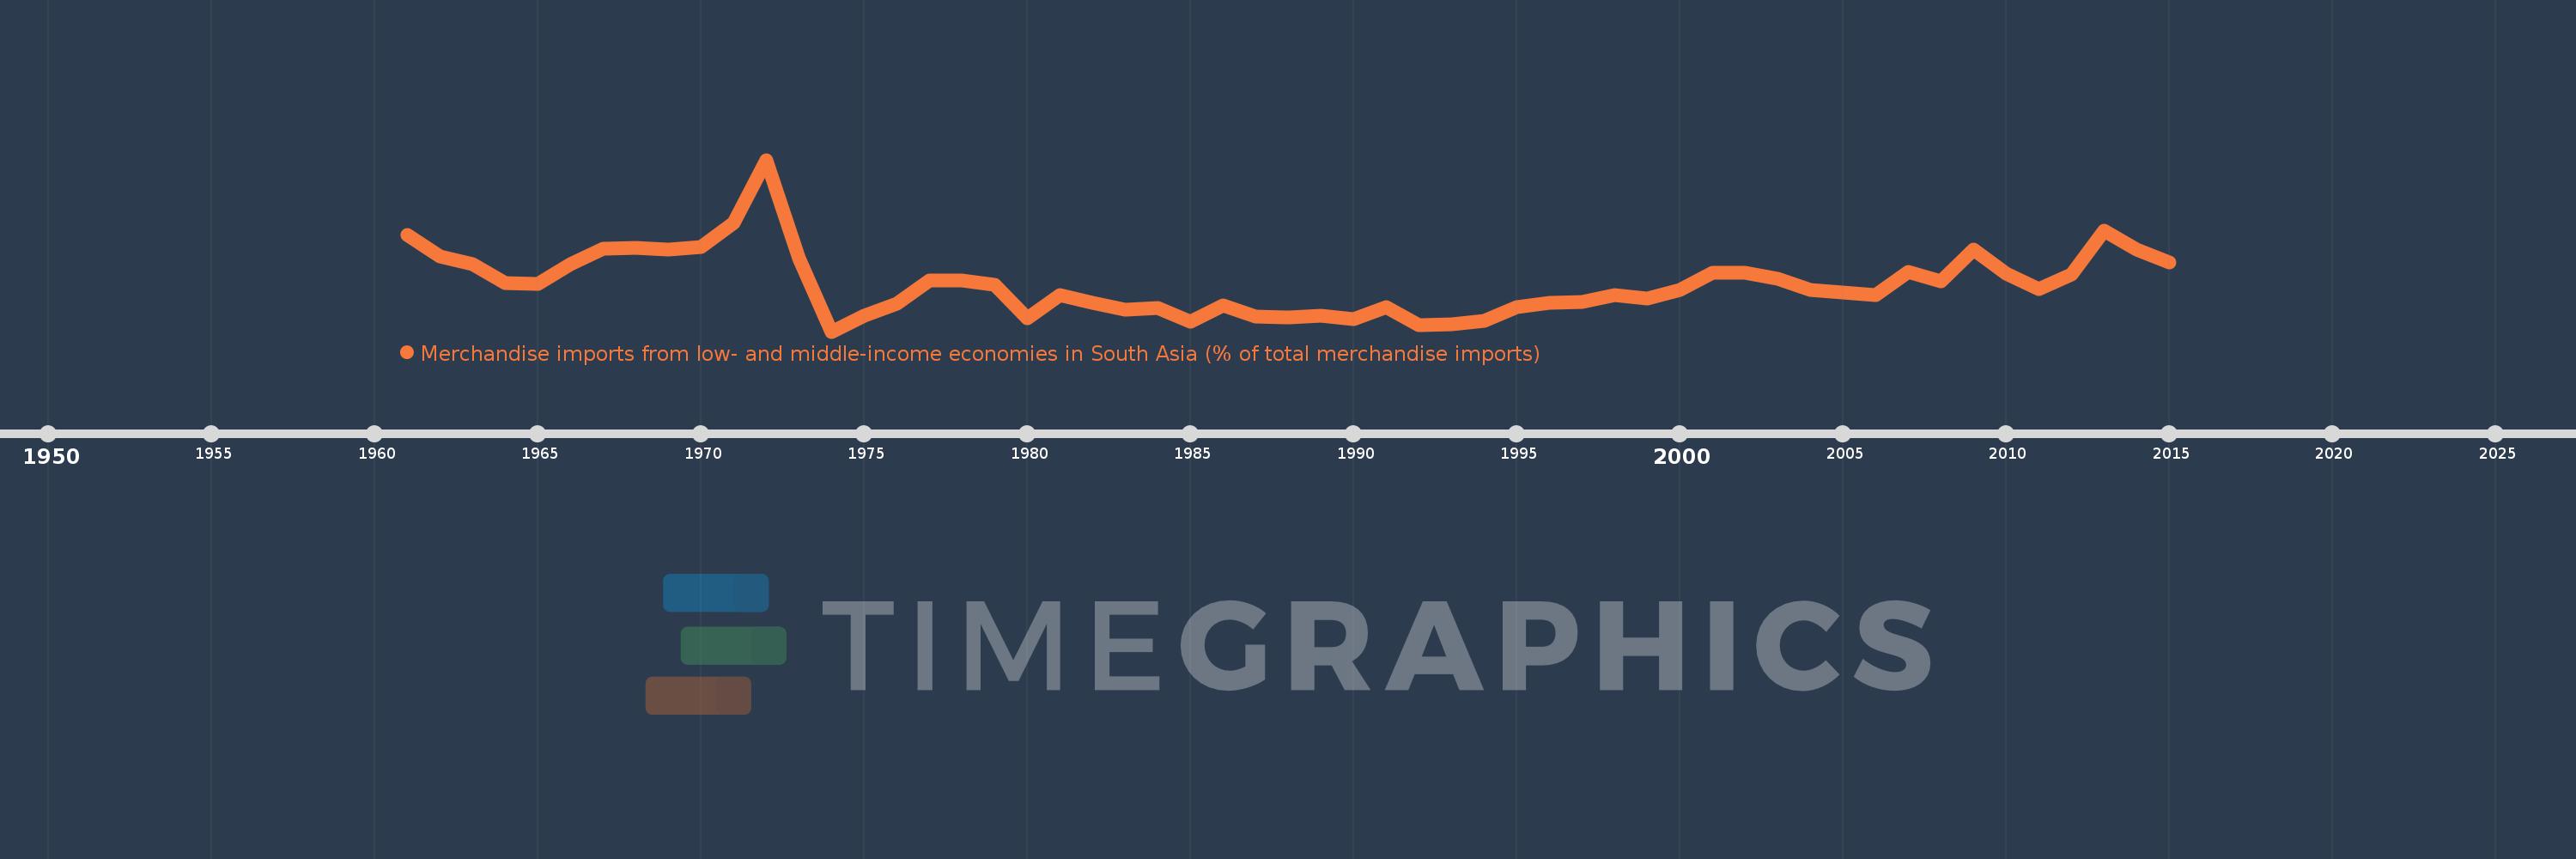
Merchandise imports from low- and middle-income economies in South Asia (% of total merchandise imports)
2015,2014,2013,2012,2011,2010,2009,2008,2007,2006,2005,2004,2003,2002,2001,2000,1999,1998,1997,1996,1995,1994,1993,1992,1991,1990,1989,1988,1987,1986,1985,1984,1983,1982,1981,1980,1979,1978,1977,1976,1975,1974,1973,1972,1971,1970,1969,1968,1967,1966,1965,1964,1963,1962,1961
This statistics in other country:
AfghanistanAlbaniaAlgeriaAngolaAntigua and BarbudaArab WorldArgentinaArmeniaArubaAustraliaAustriaAzerbaijanBahamas, TheBahrainBangladeshBarbadosBelarusBelgiumBelizeBeninBermudaBoliviaBrazilBrunei DarussalamBulgariaBurkina FasoBurundiCabo VerdeCambodiaCameroonCanadaCaribbean small statesCentral African RepublicCentral Europe and the BalticsChadChileChinaColombiaCongo, Dem. Rep.Congo, Rep.Costa RicaCote d'IvoireCroatiaCubaCyprusCzech RepublicDenmarkDjiboutiDominicaDominican RepublicEarly-demographic dividendEast Asia & PacificEast Asia & Pacific (excluding high income)East Asia & Pacific (IDA & IBRD countries)EcuadorEgypt, Arab Rep.El SalvadorEstoniaEthiopiaEuro areaEurope & Central AsiaEurope & Central Asia (excluding high income)Europe & Central Asia (IDA & IBRD countries)European UnionFaroe IslandsFijiFinlandFragile and conflict affected situationsFranceGabonGambia, TheGeorgiaGermanyGhanaGibraltarGreeceGreenlandGrenadaGuatemalaGuineaGuyanaHaitiHeavily indebted poor countries (HIPC)High incomeHondurasHong Kong SAR, ChinaHungaryIBRD onlyIcelandIDA & IBRD totalIDA blendIDA onlyIDA totalIndiaIndonesiaIran, Islamic Rep.IraqIrelandIsraelItalyJamaicaJapanJordanKazakhstanKenyaKiribatiKorea, Dem. People’s Rep.Korea, Rep.KosovoKuwaitKyrgyz RepublicLao PDRLate-demographic dividendLatin America & Caribbean Latin America & Caribbean (excluding high income)Latin America & the Caribbean (IDA & IBRD countries)LatviaLeast developed countries: UN classificationLebanonLiberiaLibyaLithuaniaLow & middle incomeLow incomeLower middle incomeLuxembourgMacao SAR, ChinaMacedonia, FYRMadagascarMalawiMalaysiaMaldivesMaliMaltaMauritaniaMauritiusMexicoMiddle East & North AfricaMiddle East & North Africa (excluding high income)Middle East & North Africa (IDA & IBRD countries)Middle incomeMoldovaMongoliaMontenegroMoroccoMozambiqueMyanmarNauruNepalNetherlandsNew CaledoniaNew ZealandNicaraguaNigerNigeriaNorth AmericaNorwayOECD membersOmanOther small statesPacific island small statesPakistanPanamaPapua New GuineaParaguayPeruPhilippinesPolandPortugalPost-demographic dividendPre-demographic dividendQatarRomaniaRussian FederationRwandaSamoaSaudi ArabiaSenegalSerbiaSeychellesSierra LeoneSingaporeSlovak RepublicSloveniaSmall statesSolomon IslandsSomaliaSouth AfricaSouth AsiaSouth Asia (IDA & IBRD)SpainSri LankaSt. Kitts and NevisSt. LuciaSt. Vincent and the GrenadinesSub-Saharan Africa Sub-Saharan Africa (excluding high income)Sub-Saharan Africa (IDA & IBRD countries)SudanSurinameSwedenSwitzerlandSyrian Arab RepublicTajikistanTanzaniaThailandTogoTongaTrinidad and TobagoTunisiaTurkeyTurkmenistanUgandaUkraineUnited Arab EmiratesUnited KingdomUnited StatesUpper middle incomeUruguayUzbekistanVanuatuVenezuela, RBVietnamWorldYemen, Rep.ZambiaZimbabwe Timeline:
This timeline shows a graph from 1961 to 2015 of Sudan. No data until 1960. Number of actual observations by date: 55.
Source name:
World Development Indicators
Source organization:
World Bank staff estimates based data from International Monetary Fund's Direction of Trade database.
Categories, topics:
Private Sector, Trade
Last updated:
apr 23, 2017
Indicators value changes by year
Maximum:
21.165
jan 1, 1972
At the date of observation
Value
Absolute change
Change from previous value
jan 1, 1961
12.355
+12.355
0.0%
jan 1, 1962
9.853
-2.501
-20.25%
jan 1, 1963
8.896
-0.957
-9.72%
jan 1, 1964
6.69
-2.206
-24.79%
jan 1, 1965
6.625
-0.065
-0.97%
jan 1, 1966
8.947
+2.321
35.04%
jan 1, 1967
10.742
+1.795
20.06%
jan 1, 1968
10.788
+0.046
0.43%
jan 1, 1969
10.598
-0.19
-1.76%
jan 1, 1970
10.977
+0.379
3.57%
jan 1, 1971
13.739
+2.763
25.17%
jan 1, 1972
21.165
+7.425
54.04%
jan 1, 1973
9.598
-11.566
-54.65%
jan 1, 1974
1.013
-8.585
-89.45%
jan 1, 1975
2.869
+1.857
183.28%
jan 1, 1976
4.326
+1.456
50.75%
jan 1, 1977
7.031
+2.705
62.54%
jan 1, 1978
7.05
+0.019
0.26%
jan 1, 1979
6.48
-0.569
-8.08%
jan 1, 1980
2.552
-3.928
-60.62%
jan 1, 1981
5.245
+2.693
105.55%
jan 1, 1982
4.422
-0.823
-15.7%
jan 1, 1983
3.595
-0.827
-18.7%
jan 1, 1984
3.819
+0.224
6.23%
jan 1, 1985
2.213
-1.606
-42.05%
jan 1, 1986
4.046
+1.833
82.83%
jan 1, 1987
2.734
-1.312
-32.42%
jan 1, 1988
2.695
-0.039
-1.43%
jan 1, 1989
2.911
+0.216
8.0%
jan 1, 1990
2.452
-0.459
-15.77%
jan 1, 1991
3.913
+1.461
59.6%
jan 1, 1992
1.773
-2.14
-54.69%
jan 1, 1993
1.894
+0.121
6.82%
jan 1, 1994
2.261
+0.367
19.4%
jan 1, 1995
3.859
+1.598
70.69%
jan 1, 1996
4.432
+0.572
14.82%
jan 1, 1997
4.459
+0.028
0.62%
jan 1, 1998
5.284
+0.824
18.49%
jan 1, 1999
4.902
-0.382
-7.22%
jan 1, 2000
5.876
+0.974
19.86%
jan 1, 2001
7.932
+2.056
35.0%
jan 1, 2002
7.884
-0.048
-0.61%
jan 1, 2003
7.187
-0.696
-8.83%
jan 1, 2004
5.919
-1.268
-17.64%
jan 1, 2005
5.55
-0.37
-6.25%
jan 1, 2006
5.33
-0.22
-3.96%
jan 1, 2007
8.062
+2.732
51.26%
jan 1, 2008
6.886
-1.176
-14.58%
jan 1, 2009
10.588
+3.702
53.77%
jan 1, 2010
7.81
-2.778
-26.24%
jan 1, 2011
5.997
-1.814
-23.22%
jan 1, 2012
7.677
+1.681
28.03%
jan 1, 2013
12.889
+5.212
67.88%
jan 1, 2014
10.616
-2.273
-17.64%
jan 1, 2015
9.134
-1.482
-13.96%
Ranking of countries by current statistics by years


Comments: