29
/
en
AIzaSyAYiBZKx7MnpbEhh9jyipgxe19OcubqV5w
April 1, 2024
105154
Chile
CHL
true
2
1
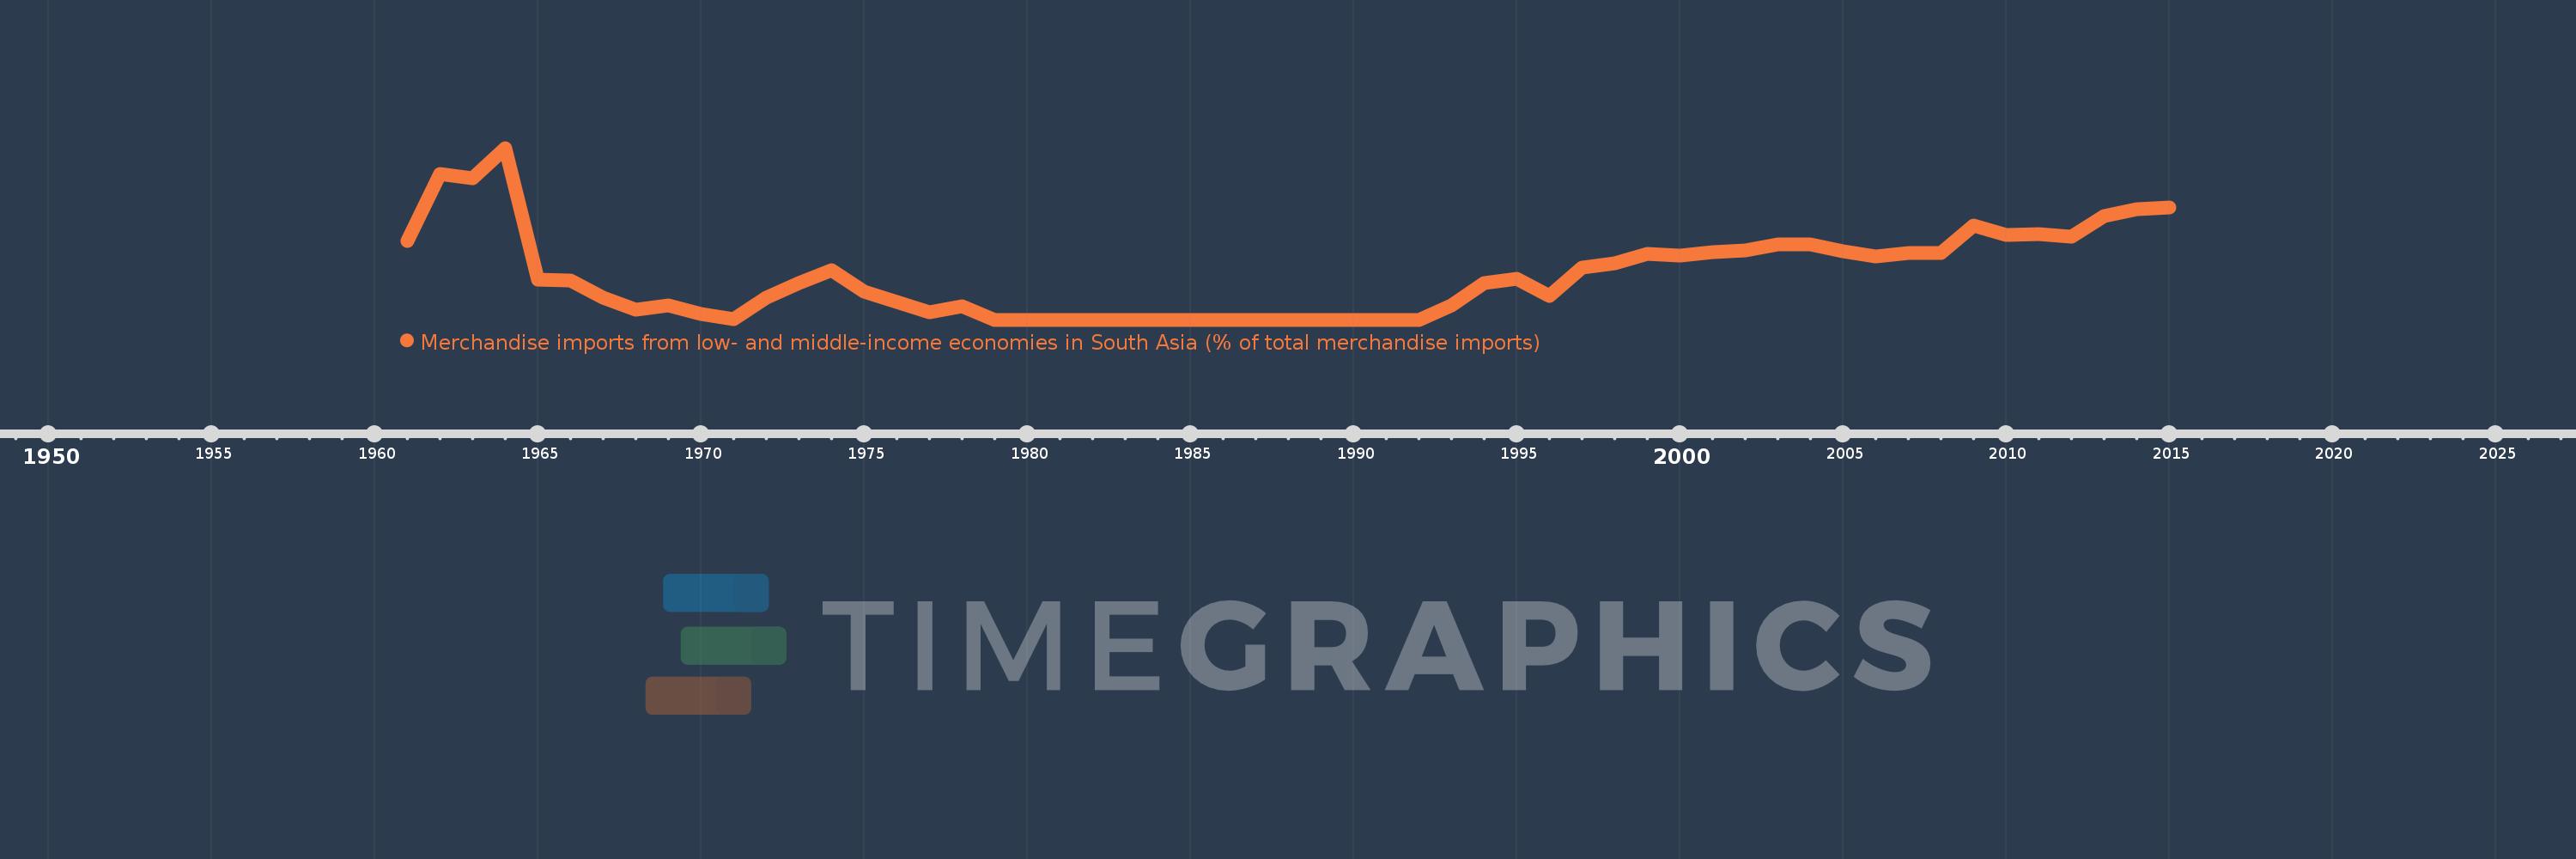
Merchandise imports from low- and middle-income economies in South Asia (% of total merchandise imports)
2015,2014,2013,2012,2011,2010,2009,2008,2007,2006,2005,2004,2003,2002,2001,2000,1999,1998,1997,1996,1995,1994,1993,1992,1991,1990,1989,1988,1987,1986,1985,1984,1983,1982,1981,1980,1979,1978,1977,1976,1975,1974,1973,1972,1971,1970,1969,1968,1967,1966,1965,1964,1963,1962,1961
This statistics in other country:
AfghanistanAlbaniaAlgeriaAngolaAntigua and BarbudaArab WorldArgentinaArmeniaArubaAustraliaAustriaAzerbaijanBahamas, TheBahrainBangladeshBarbadosBelarusBelgiumBelizeBeninBermudaBoliviaBrazilBrunei DarussalamBulgariaBurkina FasoBurundiCabo VerdeCambodiaCameroonCanadaCaribbean small statesCentral African RepublicCentral Europe and the BalticsChadChileChinaColombiaCongo, Dem. Rep.Congo, Rep.Costa RicaCote d'IvoireCroatiaCubaCyprusCzech RepublicDenmarkDjiboutiDominicaDominican RepublicEarly-demographic dividendEast Asia & PacificEast Asia & Pacific (excluding high income)East Asia & Pacific (IDA & IBRD countries)EcuadorEgypt, Arab Rep.El SalvadorEstoniaEthiopiaEuro areaEurope & Central AsiaEurope & Central Asia (excluding high income)Europe & Central Asia (IDA & IBRD countries)European UnionFaroe IslandsFijiFinlandFragile and conflict affected situationsFranceGabonGambia, TheGeorgiaGermanyGhanaGibraltarGreeceGreenlandGrenadaGuatemalaGuineaGuyanaHaitiHeavily indebted poor countries (HIPC)High incomeHondurasHong Kong SAR, ChinaHungaryIBRD onlyIcelandIDA & IBRD totalIDA blendIDA onlyIDA totalIndiaIndonesiaIran, Islamic Rep.IraqIrelandIsraelItalyJamaicaJapanJordanKazakhstanKenyaKiribatiKorea, Dem. People’s Rep.Korea, Rep.KosovoKuwaitKyrgyz RepublicLao PDRLate-demographic dividendLatin America & Caribbean Latin America & Caribbean (excluding high income)Latin America & the Caribbean (IDA & IBRD countries)LatviaLeast developed countries: UN classificationLebanonLiberiaLibyaLithuaniaLow & middle incomeLow incomeLower middle incomeLuxembourgMacao SAR, ChinaMacedonia, FYRMadagascarMalawiMalaysiaMaldivesMaliMaltaMauritaniaMauritiusMexicoMiddle East & North AfricaMiddle East & North Africa (excluding high income)Middle East & North Africa (IDA & IBRD countries)Middle incomeMoldovaMongoliaMontenegroMoroccoMozambiqueMyanmarNauruNepalNetherlandsNew CaledoniaNew ZealandNicaraguaNigerNigeriaNorth AmericaNorwayOECD membersOmanOther small statesPacific island small statesPakistanPanamaPapua New GuineaParaguayPeruPhilippinesPolandPortugalPost-demographic dividendPre-demographic dividendQatarRomaniaRussian FederationRwandaSamoaSaudi ArabiaSenegalSerbiaSeychellesSierra LeoneSingaporeSlovak RepublicSloveniaSmall statesSolomon IslandsSomaliaSouth AfricaSouth AsiaSouth Asia (IDA & IBRD)SpainSri LankaSt. Kitts and NevisSt. LuciaSt. Vincent and the GrenadinesSub-Saharan Africa Sub-Saharan Africa (excluding high income)Sub-Saharan Africa (IDA & IBRD countries)SudanSurinameSwedenSwitzerlandSyrian Arab RepublicTajikistanTanzaniaThailandTogoTongaTrinidad and TobagoTunisiaTurkeyTurkmenistanUgandaUkraineUnited Arab EmiratesUnited KingdomUnited StatesUpper middle incomeUruguayUzbekistanVanuatuVenezuela, RBVietnamWorldYemen, Rep.ZambiaZimbabwe Timeline:
This timeline shows a graph from 1961 to 2015 of Chile. No data until 1960. Number of actual observations by date: 55.
Source name:
World Development Indicators
Source organization:
World Bank staff estimates based data from International Monetary Fund's Direction of Trade database.
Categories, topics:
Private Sector, Trade
Last updated:
apr 23, 2017
Indicators value changes by year
At the date of observation
Value
Absolute change
Change from previous value
jan 1, 1961
0.802
+0.802
0.0%
jan 1, 1962
1.491
+0.689
85.93%
jan 1, 1963
1.447
-0.044
-2.93%
jan 1, 1964
1.758
+0.311
21.47%
jan 1, 1965
0.411
-1.347
-76.63%
jan 1, 1966
0.398
-0.013
-3.2%
jan 1, 1967
0.224
-0.174
-43.65%
jan 1, 1968
0.103
-0.121
-53.87%
jan 1, 1969
0.149
+0.046
44.57%
jan 1, 1970
0.06
-0.09
-60.17%
jan 1, 1971
0.009
-0.051
-85.56%
jan 1, 1972
0.226
+0.217
2.52K%
jan 1, 1973
0.374
+0.148
65.85%
jan 1, 1974
0.504
+0.13
34.71%
jan 1, 1975
0.284
-0.22
-43.72%
jan 1, 1976
0.182
-0.101
-35.65%
jan 1, 1977
0.077
-0.105
-57.58%
jan 1, 1978
0.142
+0.064
82.91%
jan 1, 1979
0.0
-0.142
-100.0%
jan 1, 1993
0.145
+0.145
%
jan 1, 1994
0.373
+0.228
156.95%
jan 1, 1995
0.415
+0.042
11.31%
jan 1, 1996
0.241
-0.174
-41.99%
jan 1, 1997
0.536
+0.295
122.33%
jan 1, 1998
0.578
+0.042
7.85%
jan 1, 1999
0.672
+0.094
16.32%
jan 1, 2000
0.654
-0.019
-2.76%
jan 1, 2001
0.689
+0.036
5.48%
jan 1, 2002
0.713
+0.023
3.38%
jan 1, 2003
0.773
+0.061
8.52%
jan 1, 2004
0.772
-0.001
-0.16%
jan 1, 2005
0.704
-0.068
-8.8%
jan 1, 2006
0.652
-0.053
-7.47%
jan 1, 2007
0.685
+0.033
5.03%
jan 1, 2008
0.687
+0.003
0.38%
jan 1, 2009
0.962
+0.275
40.07%
jan 1, 2010
0.867
-0.096
-9.93%
jan 1, 2011
0.877
+0.01
1.13%
jan 1, 2012
0.848
-0.029
-3.33%
jan 1, 2013
1.063
+0.215
25.39%
jan 1, 2014
1.133
+0.07
6.58%
jan 1, 2015
1.148
+0.015
1.32%
Ranking of countries by current statistics by years


Comments: