29
/
en
AIzaSyAYiBZKx7MnpbEhh9jyipgxe19OcubqV5w
April 1, 2024
59126
Sub-Saharan Africa
SSF
false
2
1
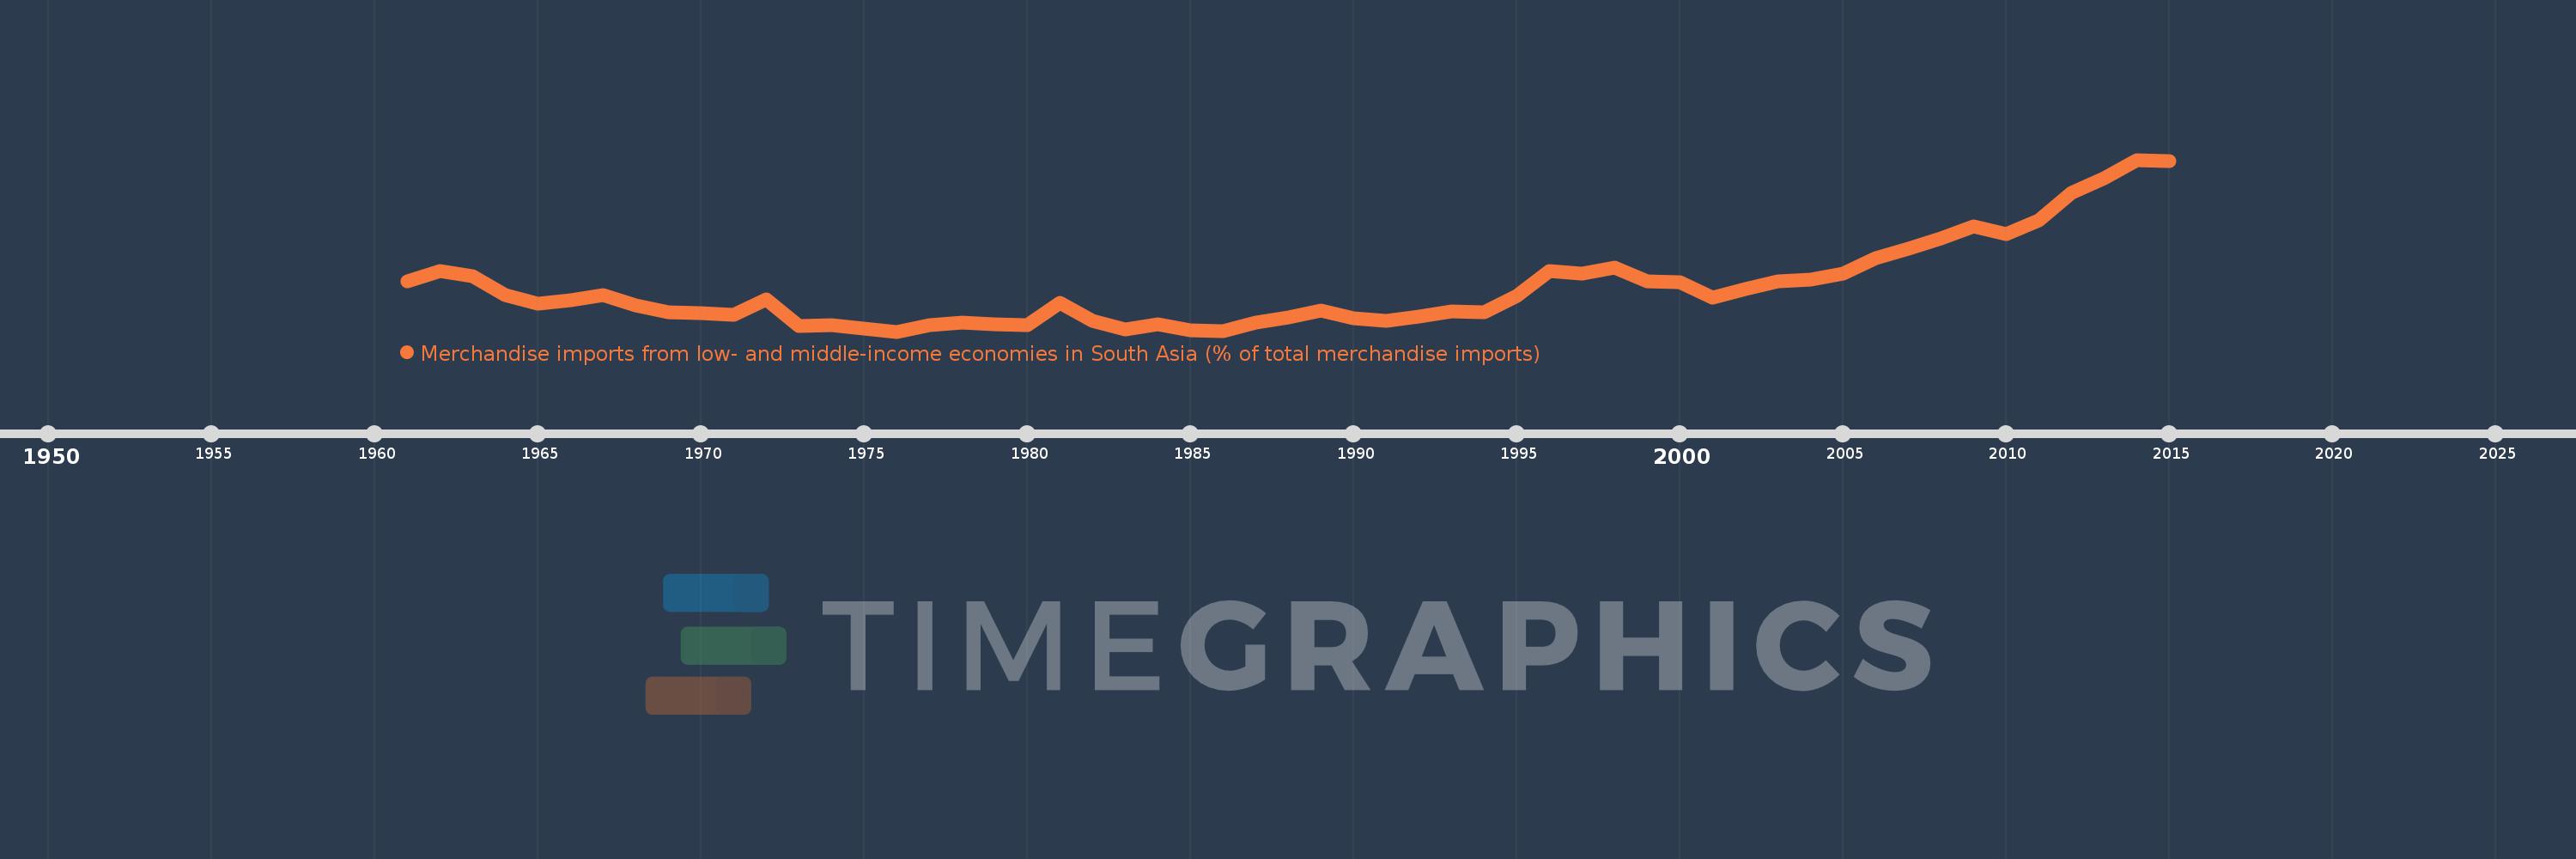
Merchandise imports from low- and middle-income economies in South Asia (% of total merchandise imports)
2015,2014,2013,2012,2011,2010,2009,2008,2007,2006,2005,2004,2003,2002,2001,2000,1999,1998,1997,1996,1995,1994,1993,1992,1991,1990,1989,1988,1987,1986,1985,1984,1983,1982,1981,1980,1979,1978,1977,1976,1975,1974,1973,1972,1971,1970,1969,1968,1967,1966,1965,1964,1963,1962,1961
This statistics in other country:
AfghanistanAlbaniaAlgeriaAngolaAntigua and BarbudaArab WorldArgentinaArmeniaArubaAustraliaAustriaAzerbaijanBahamas, TheBahrainBangladeshBarbadosBelarusBelgiumBelizeBeninBermudaBoliviaBrazilBrunei DarussalamBulgariaBurkina FasoBurundiCabo VerdeCambodiaCameroonCanadaCaribbean small statesCentral African RepublicCentral Europe and the BalticsChadChileChinaColombiaCongo, Dem. Rep.Congo, Rep.Costa RicaCote d'IvoireCroatiaCubaCyprusCzech RepublicDenmarkDjiboutiDominicaDominican RepublicEarly-demographic dividendEast Asia & PacificEast Asia & Pacific (excluding high income)East Asia & Pacific (IDA & IBRD countries)EcuadorEgypt, Arab Rep.El SalvadorEstoniaEthiopiaEuro areaEurope & Central AsiaEurope & Central Asia (excluding high income)Europe & Central Asia (IDA & IBRD countries)European UnionFaroe IslandsFijiFinlandFragile and conflict affected situationsFranceGabonGambia, TheGeorgiaGermanyGhanaGibraltarGreeceGreenlandGrenadaGuatemalaGuineaGuyanaHaitiHeavily indebted poor countries (HIPC)High incomeHondurasHong Kong SAR, ChinaHungaryIBRD onlyIcelandIDA & IBRD totalIDA blendIDA onlyIDA totalIndiaIndonesiaIran, Islamic Rep.IraqIrelandIsraelItalyJamaicaJapanJordanKazakhstanKenyaKiribatiKorea, Dem. People’s Rep.Korea, Rep.KosovoKuwaitKyrgyz RepublicLao PDRLate-demographic dividendLatin America & Caribbean Latin America & Caribbean (excluding high income)Latin America & the Caribbean (IDA & IBRD countries)LatviaLeast developed countries: UN classificationLebanonLiberiaLibyaLithuaniaLow & middle incomeLow incomeLower middle incomeLuxembourgMacao SAR, ChinaMacedonia, FYRMadagascarMalawiMalaysiaMaldivesMaliMaltaMauritaniaMauritiusMexicoMiddle East & North AfricaMiddle East & North Africa (excluding high income)Middle East & North Africa (IDA & IBRD countries)Middle incomeMoldovaMongoliaMontenegroMoroccoMozambiqueMyanmarNauruNepalNetherlandsNew CaledoniaNew ZealandNicaraguaNigerNigeriaNorth AmericaNorwayOECD membersOmanOther small statesPacific island small statesPakistanPanamaPapua New GuineaParaguayPeruPhilippinesPolandPortugalPost-demographic dividendPre-demographic dividendQatarRomaniaRussian FederationRwandaSamoaSaudi ArabiaSenegalSerbiaSeychellesSierra LeoneSingaporeSlovak RepublicSloveniaSmall statesSolomon IslandsSomaliaSouth AfricaSouth AsiaSouth Asia (IDA & IBRD)SpainSri LankaSt. Kitts and NevisSt. LuciaSt. Vincent and the GrenadinesSub-Saharan Africa Sub-Saharan Africa (excluding high income)Sub-Saharan Africa (IDA & IBRD countries)SudanSurinameSwedenSwitzerlandSyrian Arab RepublicTajikistanTanzaniaThailandTogoTongaTrinidad and TobagoTunisiaTurkeyTurkmenistanUgandaUkraineUnited Arab EmiratesUnited KingdomUnited StatesUpper middle incomeUruguayUzbekistanVanuatuVenezuela, RBVietnamWorldYemen, Rep.ZambiaZimbabwe Timeline:
This timeline shows a graph from 1961 to 2015 of Sub-Saharan Africa . No data until 1960. Number of actual observations by date: 55.
Source name:
World Development Indicators
Source organization:
World Bank staff estimates based data from International Monetary Fund's Direction of Trade database.
Categories, topics:
Private Sector, Trade
Last updated:
apr 23, 2017
Indicators value changes by year
At the date of observation
Value
Absolute change
Change from previous value
jan 1, 1961
2.758
+2.758
0.0%
jan 1, 1962
3.079
+0.32
11.61%
jan 1, 1963
2.938
-0.14
-4.56%
jan 1, 1964
2.335
-0.604
-20.54%
jan 1, 1965
2.035
-0.299
-12.82%
jan 1, 1966
2.161
+0.125
6.17%
jan 1, 1967
2.309
+0.148
6.87%
jan 1, 1968
1.987
-0.322
-13.97%
jan 1, 1969
1.768
-0.219
-11.01%
jan 1, 1970
1.736
-0.032
-1.79%
jan 1, 1971
1.702
-0.034
-1.97%
jan 1, 1972
2.189
+0.487
28.63%
jan 1, 1973
1.339
-0.85
-38.83%
jan 1, 1974
1.35
+0.011
0.85%
jan 1, 1975
1.257
-0.093
-6.92%
jan 1, 1976
1.157
-0.1
-7.98%
jan 1, 1977
1.356
+0.199
17.19%
jan 1, 1978
1.435
+0.079
5.82%
jan 1, 1979
1.401
-0.033
-2.31%
jan 1, 1980
1.354
-0.047
-3.37%
jan 1, 1981
2.081
+0.727
53.66%
jan 1, 1982
1.498
-0.583
-28.03%
jan 1, 1983
1.227
-0.27
-18.04%
jan 1, 1984
1.384
+0.157
12.76%
jan 1, 1985
1.193
-0.191
-13.8%
jan 1, 1986
1.167
-0.026
-2.18%
jan 1, 1987
1.432
+0.265
22.71%
jan 1, 1988
1.616
+0.184
12.83%
jan 1, 1989
1.824
+0.208
12.85%
jan 1, 1990
1.577
-0.247
-13.55%
jan 1, 1991
1.497
-0.079
-5.02%
jan 1, 1992
1.638
+0.14
9.38%
jan 1, 1993
1.808
+0.17
10.38%
jan 1, 1994
1.771
-0.037
-2.05%
jan 1, 1995
2.306
+0.535
30.22%
jan 1, 1996
3.099
+0.793
34.39%
jan 1, 1997
3.015
-0.084
-2.7%
jan 1, 1998
3.192
+0.177
5.86%
jan 1, 1999
2.773
-0.419
-13.14%
jan 1, 2000
2.735
-0.038
-1.37%
jan 1, 2001
2.236
-0.499
-18.25%
jan 1, 2002
2.525
+0.289
12.95%
jan 1, 2003
2.76
+0.235
9.31%
jan 1, 2004
2.821
+0.061
2.22%
jan 1, 2005
3.01
+0.189
6.68%
jan 1, 2006
3.5
+0.49
16.27%
jan 1, 2007
3.815
+0.315
9.02%
jan 1, 2008
4.129
+0.313
8.22%
jan 1, 2009
4.511
+0.382
9.25%
jan 1, 2010
4.276
-0.234
-5.19%
jan 1, 2011
4.717
+0.44
10.3%
jan 1, 2012
5.58
+0.863
18.31%
jan 1, 2013
6.046
+0.466
8.35%
jan 1, 2014
6.64
+0.594
9.82%
jan 1, 2015
6.611
-0.029
-0.44%
Ranking of countries by current statistics by years


Comments: