29
/
en
AIzaSyAYiBZKx7MnpbEhh9jyipgxe19OcubqV5w
April 1, 2024
46319
Low income
LIC
false
2
1
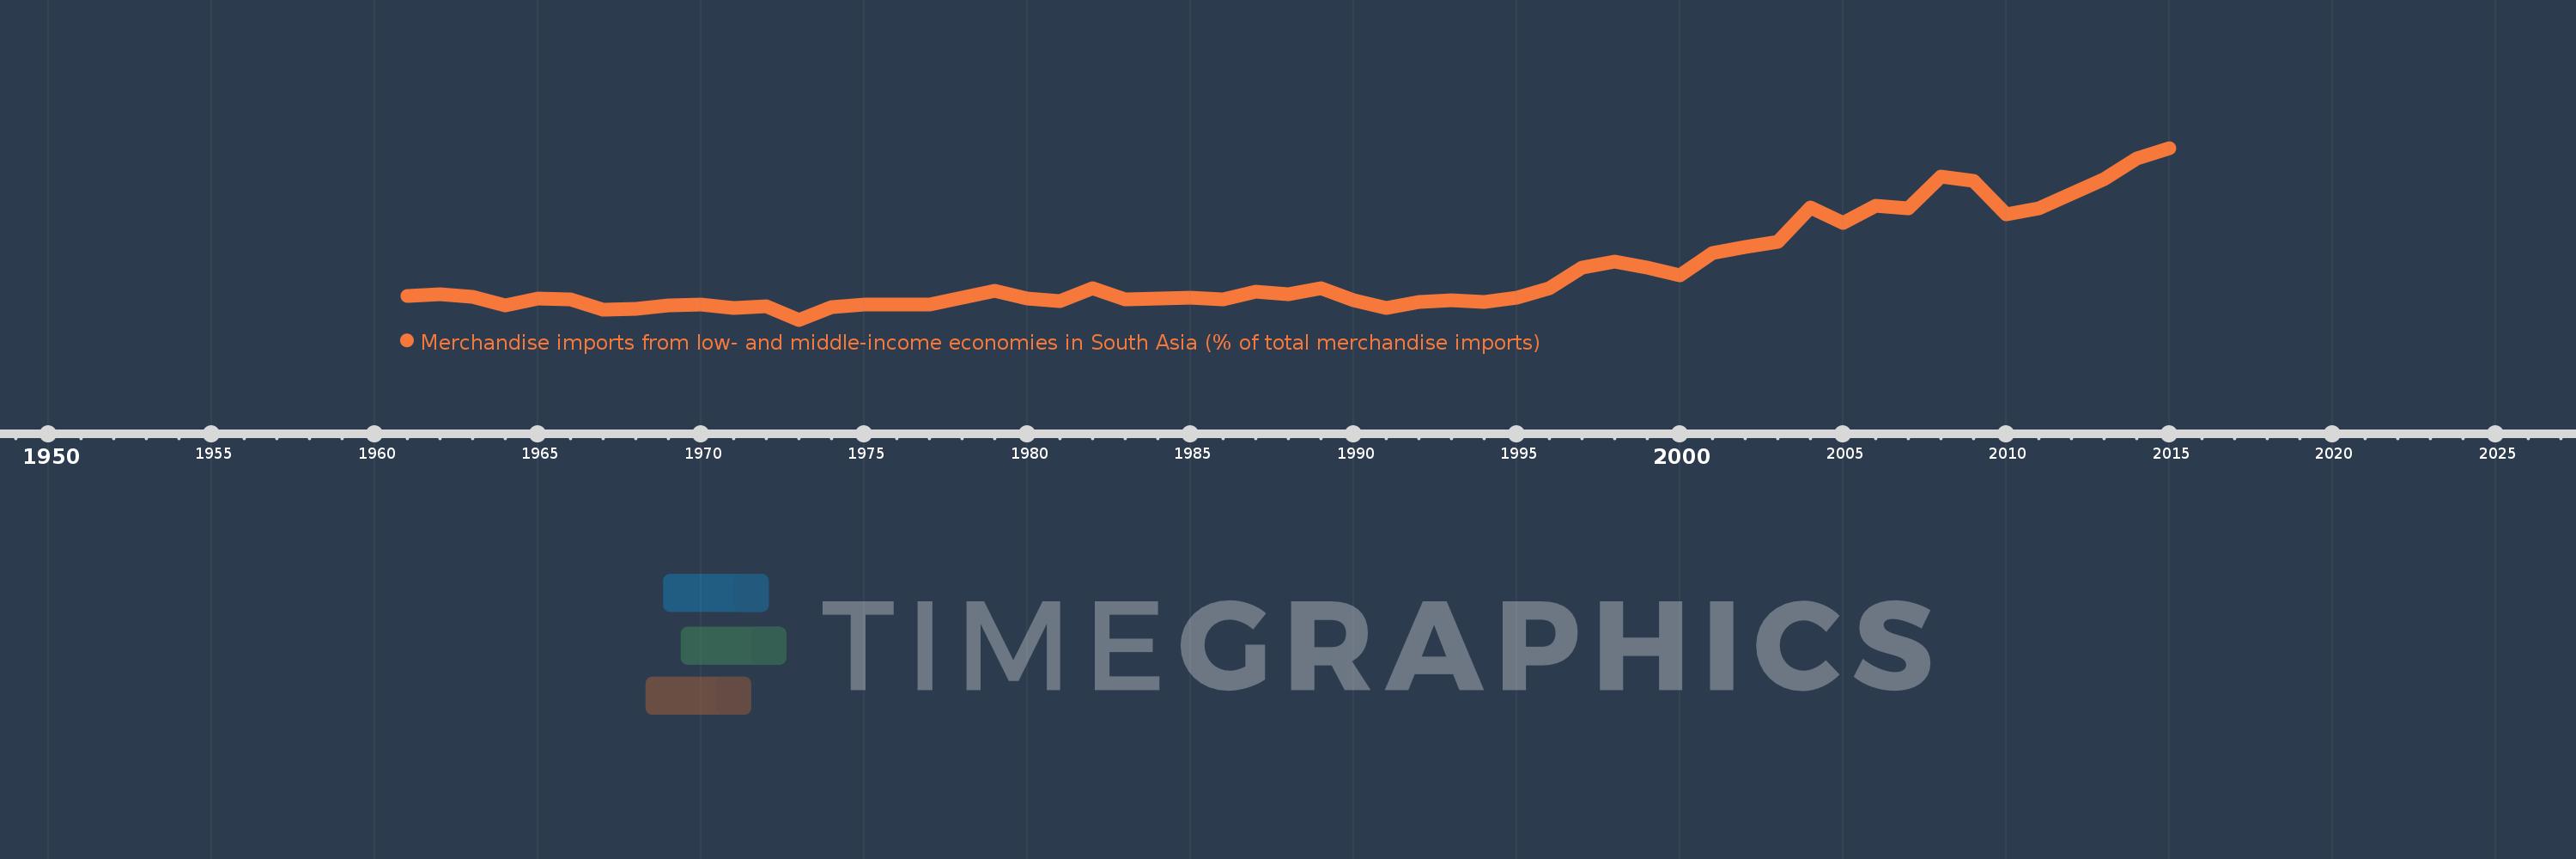
Merchandise imports from low- and middle-income economies in South Asia (% of total merchandise imports)
2015,2014,2013,2012,2011,2010,2009,2008,2007,2006,2005,2004,2003,2002,2001,2000,1999,1998,1997,1996,1995,1994,1993,1992,1991,1990,1989,1988,1987,1986,1985,1984,1983,1982,1981,1980,1979,1978,1977,1976,1975,1974,1973,1972,1971,1970,1969,1968,1967,1966,1965,1964,1963,1962,1961
This statistics in other country:
AfghanistanAlbaniaAlgeriaAngolaAntigua and BarbudaArab WorldArgentinaArmeniaArubaAustraliaAustriaAzerbaijanBahamas, TheBahrainBangladeshBarbadosBelarusBelgiumBelizeBeninBermudaBoliviaBrazilBrunei DarussalamBulgariaBurkina FasoBurundiCabo VerdeCambodiaCameroonCanadaCaribbean small statesCentral African RepublicCentral Europe and the BalticsChadChileChinaColombiaCongo, Dem. Rep.Congo, Rep.Costa RicaCote d'IvoireCroatiaCubaCyprusCzech RepublicDenmarkDjiboutiDominicaDominican RepublicEarly-demographic dividendEast Asia & PacificEast Asia & Pacific (excluding high income)East Asia & Pacific (IDA & IBRD countries)EcuadorEgypt, Arab Rep.El SalvadorEstoniaEthiopiaEuro areaEurope & Central AsiaEurope & Central Asia (excluding high income)Europe & Central Asia (IDA & IBRD countries)European UnionFaroe IslandsFijiFinlandFragile and conflict affected situationsFranceGabonGambia, TheGeorgiaGermanyGhanaGibraltarGreeceGreenlandGrenadaGuatemalaGuineaGuyanaHaitiHeavily indebted poor countries (HIPC)High incomeHondurasHong Kong SAR, ChinaHungaryIBRD onlyIcelandIDA & IBRD totalIDA blendIDA onlyIDA totalIndiaIndonesiaIran, Islamic Rep.IraqIrelandIsraelItalyJamaicaJapanJordanKazakhstanKenyaKiribatiKorea, Dem. People’s Rep.Korea, Rep.KosovoKuwaitKyrgyz RepublicLao PDRLate-demographic dividendLatin America & Caribbean Latin America & Caribbean (excluding high income)Latin America & the Caribbean (IDA & IBRD countries)LatviaLeast developed countries: UN classificationLebanonLiberiaLibyaLithuaniaLow & middle incomeLow incomeLower middle incomeLuxembourgMacao SAR, ChinaMacedonia, FYRMadagascarMalawiMalaysiaMaldivesMaliMaltaMauritaniaMauritiusMexicoMiddle East & North AfricaMiddle East & North Africa (excluding high income)Middle East & North Africa (IDA & IBRD countries)Middle incomeMoldovaMongoliaMontenegroMoroccoMozambiqueMyanmarNauruNepalNetherlandsNew CaledoniaNew ZealandNicaraguaNigerNigeriaNorth AmericaNorwayOECD membersOmanOther small statesPacific island small statesPakistanPanamaPapua New GuineaParaguayPeruPhilippinesPolandPortugalPost-demographic dividendPre-demographic dividendQatarRomaniaRussian FederationRwandaSamoaSaudi ArabiaSenegalSerbiaSeychellesSierra LeoneSingaporeSlovak RepublicSloveniaSmall statesSolomon IslandsSomaliaSouth AfricaSouth AsiaSouth Asia (IDA & IBRD)SpainSri LankaSt. Kitts and NevisSt. LuciaSt. Vincent and the GrenadinesSub-Saharan Africa Sub-Saharan Africa (excluding high income)Sub-Saharan Africa (IDA & IBRD countries)SudanSurinameSwedenSwitzerlandSyrian Arab RepublicTajikistanTanzaniaThailandTogoTongaTrinidad and TobagoTunisiaTurkeyTurkmenistanUgandaUkraineUnited Arab EmiratesUnited KingdomUnited StatesUpper middle incomeUruguayUzbekistanVanuatuVenezuela, RBVietnamWorldYemen, Rep.ZambiaZimbabwe Timeline:
This timeline shows a graph from 1961 to 2015 of Low income. No data until 1960. Number of actual observations by date: 55.
Source name:
World Development Indicators
Source organization:
World Bank staff estimates based data from International Monetary Fund's Direction of Trade database.
Categories, topics:
Private Sector, Trade
Last updated:
apr 23, 2017
Indicators value changes by year
Maximum:
12.521
jan 1, 2015
At the date of observation
Value
Absolute change
Change from previous value
jan 1, 1961
2.484
+2.484
0.0%
jan 1, 1962
2.62
+0.136
5.48%
jan 1, 1963
2.411
-0.209
-7.97%
jan 1, 1964
1.862
-0.549
-22.76%
jan 1, 1965
2.283
+0.42
22.56%
jan 1, 1966
2.222
-0.06
-2.64%
jan 1, 1967
1.55
-0.672
-30.24%
jan 1, 1968
1.601
+0.051
3.29%
jan 1, 1969
1.847
+0.246
15.35%
jan 1, 1970
1.891
+0.044
2.4%
jan 1, 1971
1.671
-0.22
-11.64%
jan 1, 1972
1.78
+0.108
6.48%
jan 1, 1973
0.87
-0.91
-51.11%
jan 1, 1974
1.707
+0.837
96.21%
jan 1, 1975
1.885
+0.178
10.4%
jan 1, 1976
1.875
-0.01
-0.51%
jan 1, 1977
1.919
+0.044
2.34%
jan 1, 1978
2.343
+0.424
22.12%
jan 1, 1979
2.845
+0.502
21.42%
jan 1, 1980
2.283
-0.562
-19.76%
jan 1, 1981
2.122
-0.16
-7.02%
jan 1, 1982
3.001
+0.879
41.42%
jan 1, 1983
2.246
-0.755
-25.15%
jan 1, 1984
2.318
+0.071
3.18%
jan 1, 1985
2.348
+0.03
1.31%
jan 1, 1986
2.225
-0.123
-5.26%
jan 1, 1987
2.765
+0.541
24.3%
jan 1, 1988
2.595
-0.171
-6.17%
jan 1, 1989
3.025
+0.43
16.59%
jan 1, 1990
2.185
-0.84
-27.78%
jan 1, 1991
1.697
-0.487
-22.31%
jan 1, 1992
2.053
+0.355
20.93%
jan 1, 1993
2.198
+0.146
7.1%
jan 1, 1994
2.074
-0.124
-5.66%
jan 1, 1995
2.395
+0.321
15.46%
jan 1, 1996
3.032
+0.637
26.62%
jan 1, 1997
4.379
+1.347
44.43%
jan 1, 1998
4.828
+0.449
10.26%
jan 1, 1999
4.411
-0.417
-8.64%
jan 1, 2000
3.907
-0.504
-11.43%
jan 1, 2001
5.37
+1.464
37.46%
jan 1, 2002
5.811
+0.441
8.21%
jan 1, 2003
6.142
+0.33
5.68%
jan 1, 2004
8.461
+2.32
37.77%
jan 1, 2005
7.445
-1.016
-12.01%
jan 1, 2006
8.625
+1.18
15.84%
jan 1, 2007
8.429
-0.195
-2.26%
jan 1, 2008
10.578
+2.149
25.49%
jan 1, 2009
10.295
-0.283
-2.68%
jan 1, 2010
8.025
-2.27
-22.05%
jan 1, 2011
8.397
+0.373
4.64%
jan 1, 2012
9.401
+1.003
11.95%
jan 1, 2013
10.386
+0.985
10.48%
jan 1, 2014
11.815
+1.43
13.77%
jan 1, 2015
12.521
+0.706
5.97%
Ranking of countries by current statistics by years


Comments: