29
/
en
AIzaSyAYiBZKx7MnpbEhh9jyipgxe19OcubqV5w
April 1, 2024
239567
Sierra Leone
SLE
true
2
1
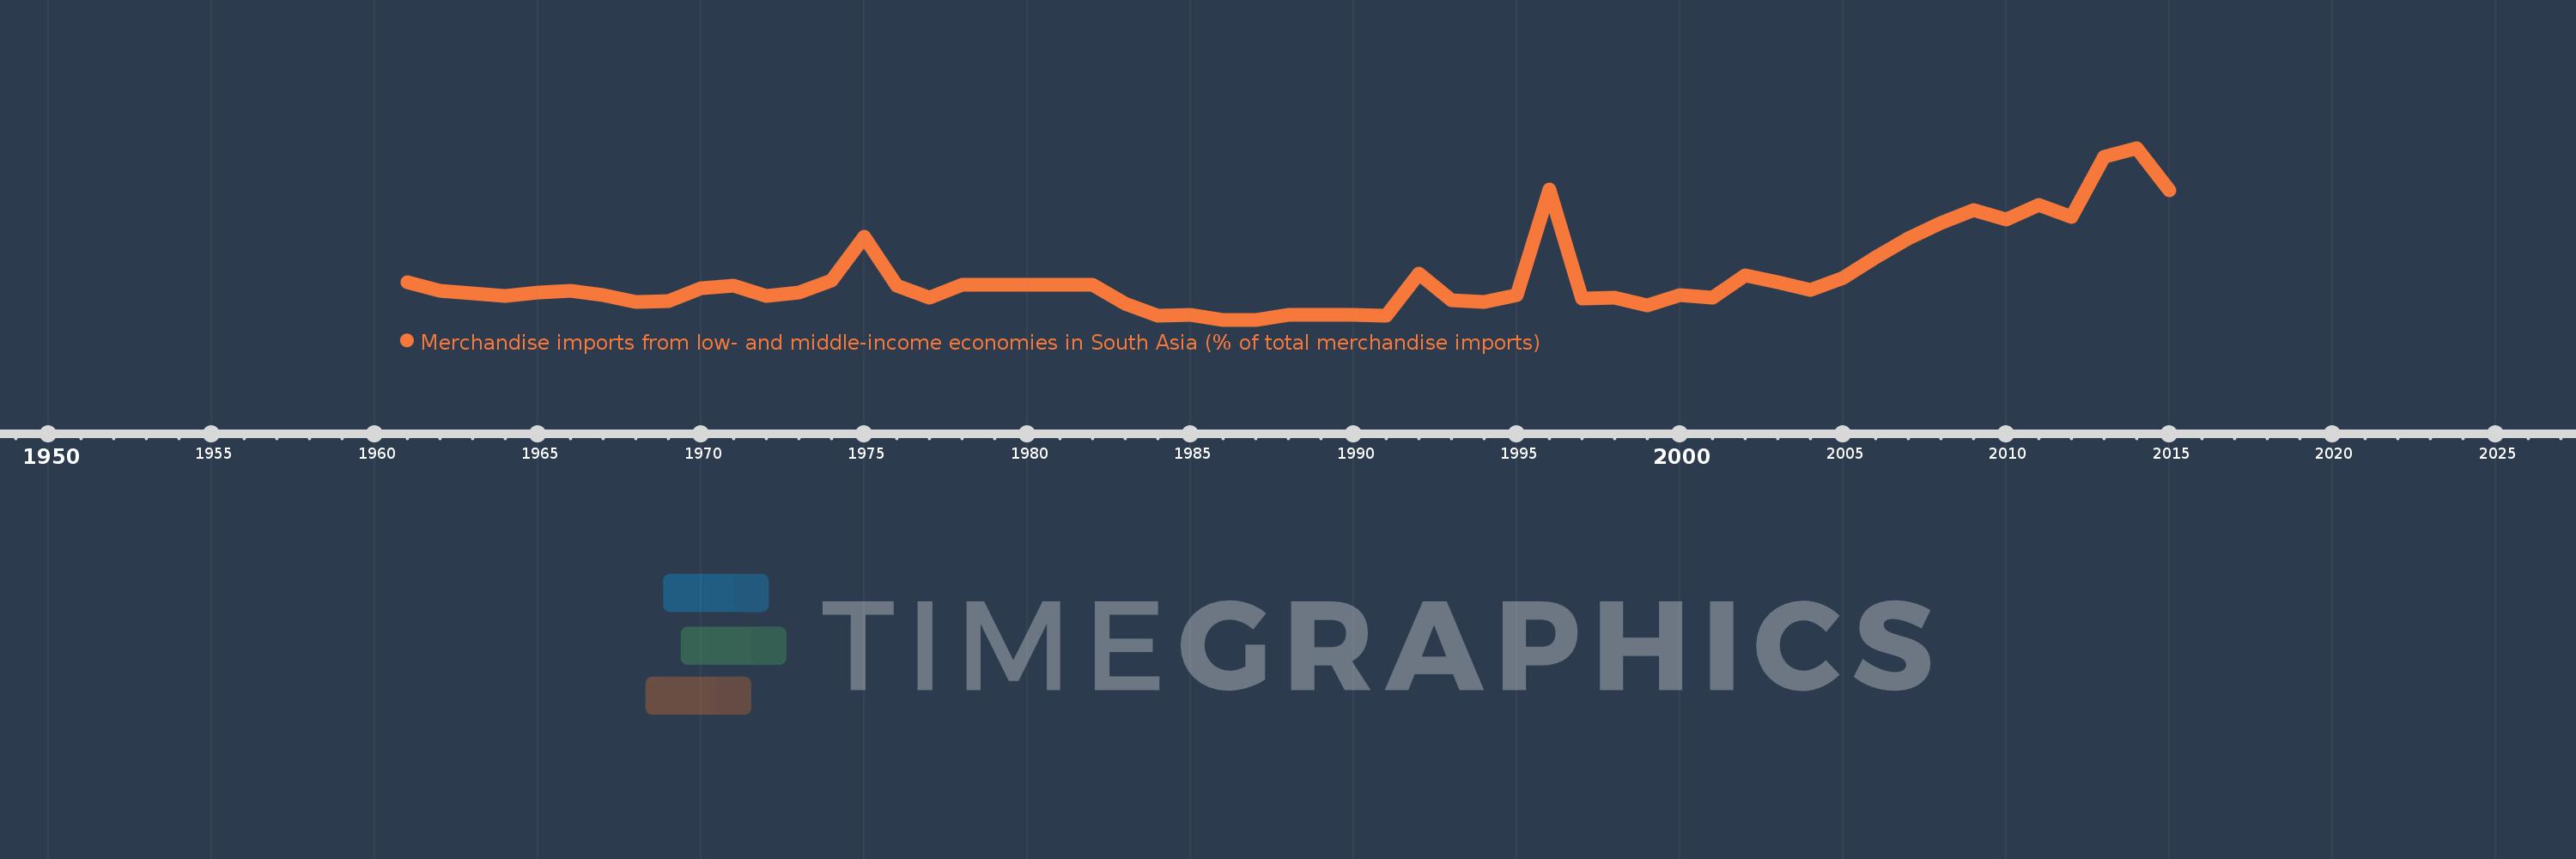
Merchandise imports from low- and middle-income economies in South Asia (% of total merchandise imports)
2015,2014,2013,2012,2011,2010,2009,2008,2007,2006,2005,2004,2003,2002,2001,2000,1999,1998,1997,1996,1995,1994,1993,1992,1991,1990,1989,1988,1987,1986,1985,1984,1983,1982,1978,1977,1976,1975,1974,1973,1972,1971,1970,1969,1968,1967,1966,1965,1964,1963,1962,1961
This statistics in other country:
AfghanistanAlbaniaAlgeriaAngolaAntigua and BarbudaArab WorldArgentinaArmeniaArubaAustraliaAustriaAzerbaijanBahamas, TheBahrainBangladeshBarbadosBelarusBelgiumBelizeBeninBermudaBoliviaBrazilBrunei DarussalamBulgariaBurkina FasoBurundiCabo VerdeCambodiaCameroonCanadaCaribbean small statesCentral African RepublicCentral Europe and the BalticsChadChileChinaColombiaCongo, Dem. Rep.Congo, Rep.Costa RicaCote d'IvoireCroatiaCubaCyprusCzech RepublicDenmarkDjiboutiDominicaDominican RepublicEarly-demographic dividendEast Asia & PacificEast Asia & Pacific (excluding high income)East Asia & Pacific (IDA & IBRD countries)EcuadorEgypt, Arab Rep.El SalvadorEstoniaEthiopiaEuro areaEurope & Central AsiaEurope & Central Asia (excluding high income)Europe & Central Asia (IDA & IBRD countries)European UnionFaroe IslandsFijiFinlandFragile and conflict affected situationsFranceGabonGambia, TheGeorgiaGermanyGhanaGibraltarGreeceGreenlandGrenadaGuatemalaGuineaGuyanaHaitiHeavily indebted poor countries (HIPC)High incomeHondurasHong Kong SAR, ChinaHungaryIBRD onlyIcelandIDA & IBRD totalIDA blendIDA onlyIDA totalIndiaIndonesiaIran, Islamic Rep.IraqIrelandIsraelItalyJamaicaJapanJordanKazakhstanKenyaKiribatiKorea, Dem. People’s Rep.Korea, Rep.KosovoKuwaitKyrgyz RepublicLao PDRLate-demographic dividendLatin America & Caribbean Latin America & Caribbean (excluding high income)Latin America & the Caribbean (IDA & IBRD countries)LatviaLeast developed countries: UN classificationLebanonLiberiaLibyaLithuaniaLow & middle incomeLow incomeLower middle incomeLuxembourgMacao SAR, ChinaMacedonia, FYRMadagascarMalawiMalaysiaMaldivesMaliMaltaMauritaniaMauritiusMexicoMiddle East & North AfricaMiddle East & North Africa (excluding high income)Middle East & North Africa (IDA & IBRD countries)Middle incomeMoldovaMongoliaMontenegroMoroccoMozambiqueMyanmarNauruNepalNetherlandsNew CaledoniaNew ZealandNicaraguaNigerNigeriaNorth AmericaNorwayOECD membersOmanOther small statesPacific island small statesPakistanPanamaPapua New GuineaParaguayPeruPhilippinesPolandPortugalPost-demographic dividendPre-demographic dividendQatarRomaniaRussian FederationRwandaSamoaSaudi ArabiaSenegalSerbiaSeychellesSierra LeoneSingaporeSlovak RepublicSloveniaSmall statesSolomon IslandsSomaliaSouth AfricaSouth AsiaSouth Asia (IDA & IBRD)SpainSri LankaSt. Kitts and NevisSt. LuciaSt. Vincent and the GrenadinesSub-Saharan Africa Sub-Saharan Africa (excluding high income)Sub-Saharan Africa (IDA & IBRD countries)SudanSurinameSwedenSwitzerlandSyrian Arab RepublicTajikistanTanzaniaThailandTogoTongaTrinidad and TobagoTunisiaTurkeyTurkmenistanUgandaUkraineUnited Arab EmiratesUnited KingdomUnited StatesUpper middle incomeUruguayUzbekistanVanuatuVenezuela, RBVietnamWorldYemen, Rep.ZambiaZimbabwe Timeline:
This timeline shows a graph from 1961 to 2015 of Sierra Leone. No data until 1960. Number of actual observations by date: 52.
Source name:
World Development Indicators
Source organization:
World Bank staff estimates based data from International Monetary Fund's Direction of Trade database.
Categories, topics:
Private Sector, Trade
Last updated:
apr 23, 2017
Indicators value changes by year
Maximum:
13.127
jan 1, 2014
At the date of observation
Value
Absolute change
Change from previous value
jan 1, 1961
2.893
+2.893
0.0%
jan 1, 1962
2.225
-0.668
-23.09%
jan 1, 1963
2.036
-0.189
-8.49%
jan 1, 1964
1.807
-0.229
-11.23%
jan 1, 1965
2.106
+0.299
16.55%
jan 1, 1966
2.235
+0.128
6.09%
jan 1, 1967
1.9
-0.335
-14.98%
jan 1, 1968
1.338
-0.562
-29.59%
jan 1, 1969
1.453
+0.115
8.58%
jan 1, 1970
2.39
+0.937
64.51%
jan 1, 1971
2.6
+0.21
8.8%
jan 1, 1972
1.805
-0.795
-30.58%
jan 1, 1973
2.051
+0.246
13.63%
jan 1, 1974
3.013
+0.962
46.93%
jan 1, 1975
6.332
+3.319
110.16%
jan 1, 1976
2.596
-3.736
-59.0%
jan 1, 1977
1.661
-0.934
-36.0%
jan 1, 1978
2.699
+1.038
62.47%
jan 1, 1982
2.699
+0.0
0.0%
jan 1, 1983
1.259
-1.44
-53.37%
jan 1, 1984
0.277
-0.981
-77.97%
jan 1, 1985
0.372
+0.095
34.16%
jan 1, 1986
0.0
-0.372
-100.0%
jan 1, 1988
0.372
+0.372
%
jan 1, 1989
0.372
+0.0
0.0%
jan 1, 1990
0.372
+0.0
0.0%
jan 1, 1991
0.282
-0.09
-24.17%
jan 1, 1992
3.528
+3.246
1.15K%
jan 1, 1993
1.491
-2.037
-57.75%
jan 1, 1994
1.339
-0.152
-10.19%
jan 1, 1995
1.888
+0.549
41.03%
jan 1, 1996
9.955
+8.068
427.32%
jan 1, 1997
1.616
-8.339
-83.77%
jan 1, 1998
1.696
+0.08
4.98%
jan 1, 1999
1.124
-0.573
-33.76%
jan 1, 2000
1.854
+0.73
64.94%
jan 1, 2001
1.704
-0.15
-8.09%
jan 1, 2002
3.396
+1.692
99.34%
jan 1, 2003
2.859
-0.537
-15.82%
jan 1, 2004
2.31
-0.549
-19.21%
jan 1, 2005
3.215
+0.905
39.2%
jan 1, 2006
4.739
+1.524
47.41%
jan 1, 2007
6.22
+1.481
31.25%
jan 1, 2008
7.391
+1.171
18.83%
jan 1, 2009
8.392
+1.001
13.54%
jan 1, 2010
7.674
-0.718
-8.55%
jan 1, 2011
8.769
+1.095
14.27%
jan 1, 2012
7.874
-0.896
-10.21%
jan 1, 2013
12.483
+4.609
58.54%
jan 1, 2014
13.127
+0.644
5.16%
jan 1, 2015
9.891
-3.235
-24.65%
Ranking of countries by current statistics by years


Comments: