29
/
en
AIzaSyAYiBZKx7MnpbEhh9jyipgxe19OcubqV5w
April 1, 2024
92806
Brunei Darussalam
BRN
true
2
1
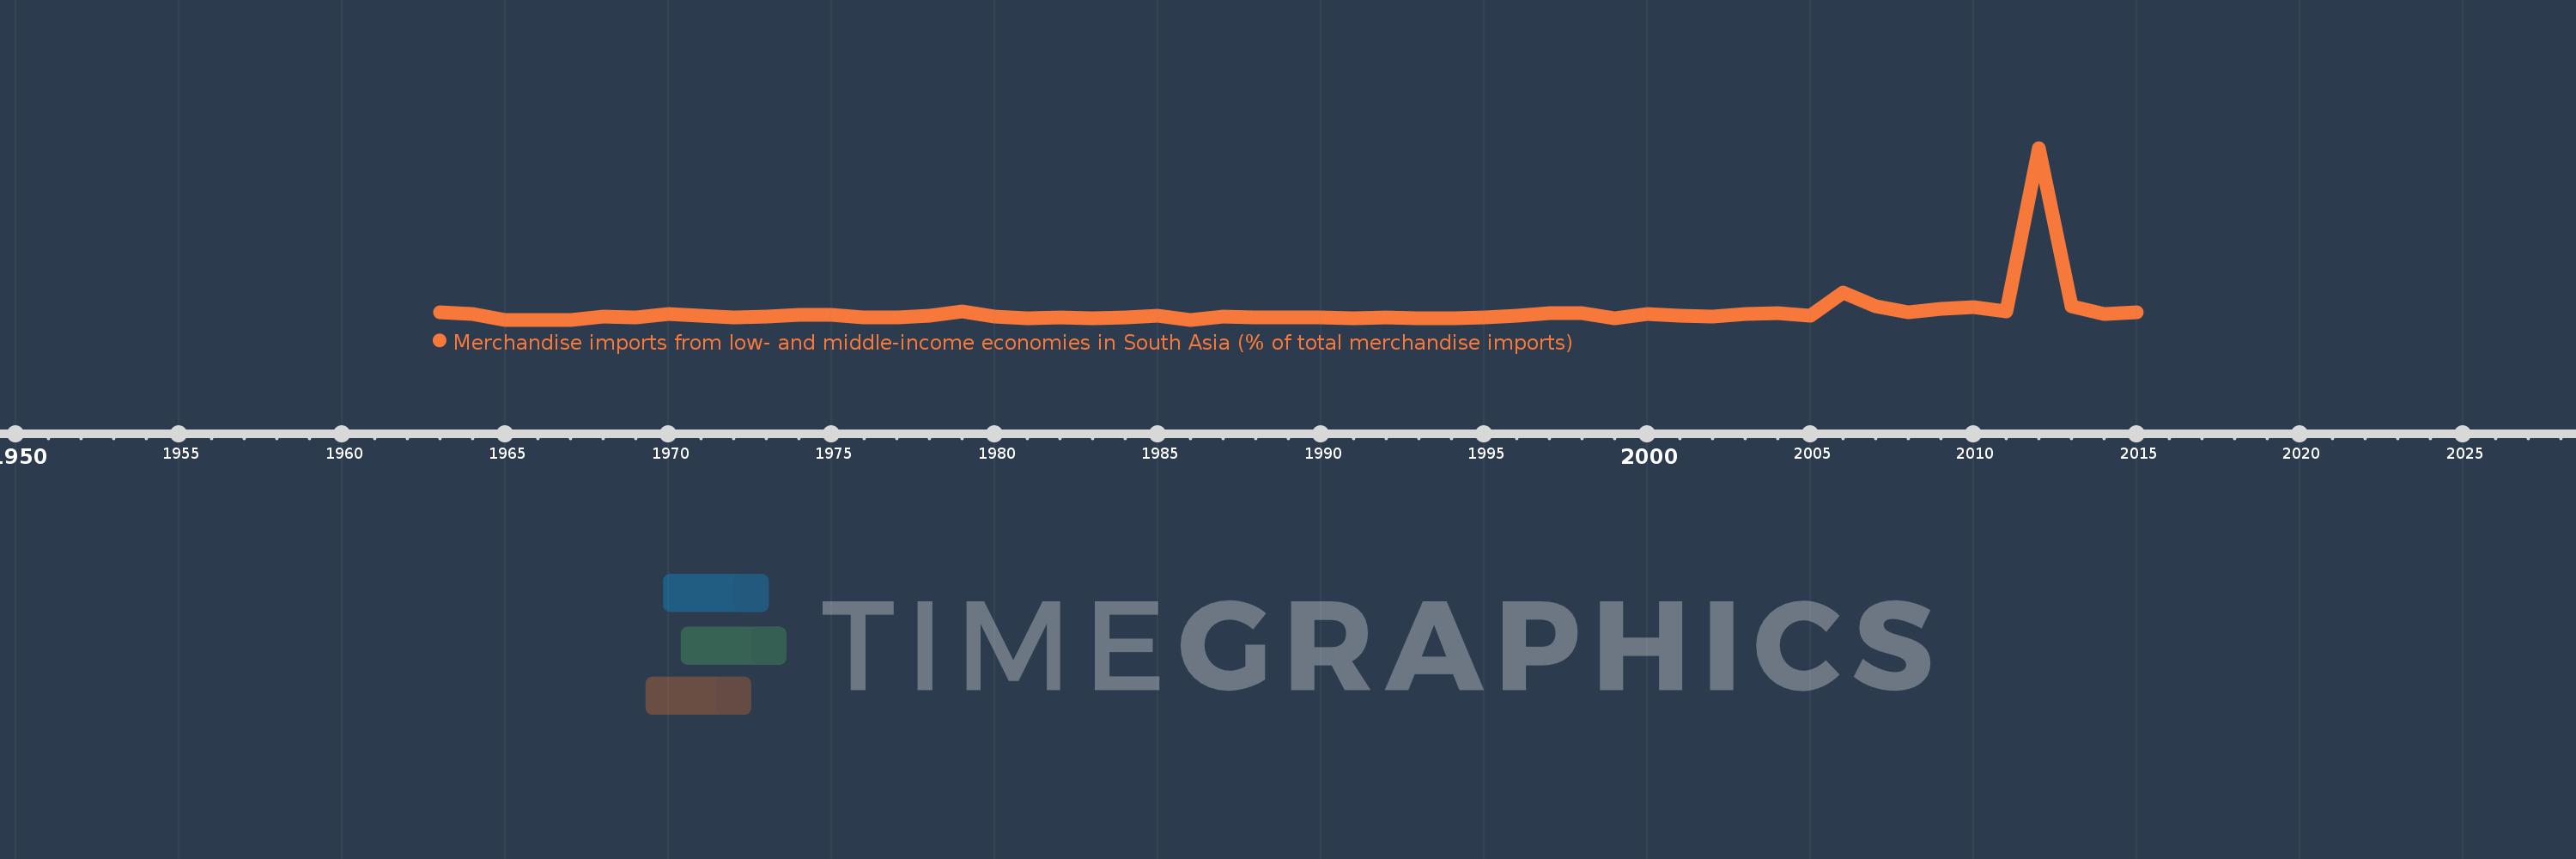
Merchandise imports from low- and middle-income economies in South Asia (% of total merchandise imports)
2015,2014,2013,2012,2011,2010,2009,2008,2007,2006,2005,2004,2003,2002,2001,2000,1999,1998,1997,1996,1995,1994,1993,1992,1991,1990,1989,1988,1987,1986,1985,1984,1983,1982,1981,1980,1979,1978,1977,1976,1975,1974,1973,1972,1970,1969,1968,1967,1966,1965,1964,1963
This statistics in other country:
AfghanistanAlbaniaAlgeriaAngolaAntigua and BarbudaArab WorldArgentinaArmeniaArubaAustraliaAustriaAzerbaijanBahamas, TheBahrainBangladeshBarbadosBelarusBelgiumBelizeBeninBermudaBoliviaBrazilBrunei DarussalamBulgariaBurkina FasoBurundiCabo VerdeCambodiaCameroonCanadaCaribbean small statesCentral African RepublicCentral Europe and the BalticsChadChileChinaColombiaCongo, Dem. Rep.Congo, Rep.Costa RicaCote d'IvoireCroatiaCubaCyprusCzech RepublicDenmarkDjiboutiDominicaDominican RepublicEarly-demographic dividendEast Asia & PacificEast Asia & Pacific (excluding high income)East Asia & Pacific (IDA & IBRD countries)EcuadorEgypt, Arab Rep.El SalvadorEstoniaEthiopiaEuro areaEurope & Central AsiaEurope & Central Asia (excluding high income)Europe & Central Asia (IDA & IBRD countries)European UnionFaroe IslandsFijiFinlandFragile and conflict affected situationsFranceGabonGambia, TheGeorgiaGermanyGhanaGibraltarGreeceGreenlandGrenadaGuatemalaGuineaGuyanaHaitiHeavily indebted poor countries (HIPC)High incomeHondurasHong Kong SAR, ChinaHungaryIBRD onlyIcelandIDA & IBRD totalIDA blendIDA onlyIDA totalIndiaIndonesiaIran, Islamic Rep.IraqIrelandIsraelItalyJamaicaJapanJordanKazakhstanKenyaKiribatiKorea, Dem. People’s Rep.Korea, Rep.KosovoKuwaitKyrgyz RepublicLao PDRLate-demographic dividendLatin America & Caribbean Latin America & Caribbean (excluding high income)Latin America & the Caribbean (IDA & IBRD countries)LatviaLeast developed countries: UN classificationLebanonLiberiaLibyaLithuaniaLow & middle incomeLow incomeLower middle incomeLuxembourgMacao SAR, ChinaMacedonia, FYRMadagascarMalawiMalaysiaMaldivesMaliMaltaMauritaniaMauritiusMexicoMiddle East & North AfricaMiddle East & North Africa (excluding high income)Middle East & North Africa (IDA & IBRD countries)Middle incomeMoldovaMongoliaMontenegroMoroccoMozambiqueMyanmarNauruNepalNetherlandsNew CaledoniaNew ZealandNicaraguaNigerNigeriaNorth AmericaNorwayOECD membersOmanOther small statesPacific island small statesPakistanPanamaPapua New GuineaParaguayPeruPhilippinesPolandPortugalPost-demographic dividendPre-demographic dividendQatarRomaniaRussian FederationRwandaSamoaSaudi ArabiaSenegalSerbiaSeychellesSierra LeoneSingaporeSlovak RepublicSloveniaSmall statesSolomon IslandsSomaliaSouth AfricaSouth AsiaSouth Asia (IDA & IBRD)SpainSri LankaSt. Kitts and NevisSt. LuciaSt. Vincent and the GrenadinesSub-Saharan Africa Sub-Saharan Africa (excluding high income)Sub-Saharan Africa (IDA & IBRD countries)SudanSurinameSwedenSwitzerlandSyrian Arab RepublicTajikistanTanzaniaThailandTogoTongaTrinidad and TobagoTunisiaTurkeyTurkmenistanUgandaUkraineUnited Arab EmiratesUnited KingdomUnited StatesUpper middle incomeUruguayUzbekistanVanuatuVenezuela, RBVietnamWorldYemen, Rep.ZambiaZimbabwe Timeline:
This timeline shows a graph from 1963 to 2015 of Brunei Darussalam. No data until 1962. Number of actual observations by date: 52.
Source name:
World Development Indicators
Source organization:
World Bank staff estimates based data from International Monetary Fund's Direction of Trade database.
Categories, topics:
Private Sector, Trade
Last updated:
apr 23, 2017
Indicators value changes by year
Maximum:
15.406
jan 1, 2012
At the date of observation
Value
Absolute change
Change from previous value
jan 1, 1963
0.671
+0.671
0.0%
jan 1, 1964
0.493
-0.179
-26.6%
jan 1, 1965
0.0
-0.493
-100.0%
jan 1, 1968
0.281
+0.281
%
jan 1, 1969
0.222
-0.058
-20.76%
jan 1, 1970
0.496
+0.274
123.2%
jan 1, 1972
0.188
-0.309
-62.17%
jan 1, 1973
0.319
+0.132
70.08%
jan 1, 1974
0.431
+0.112
34.98%
jan 1, 1975
0.406
-0.025
-5.82%
jan 1, 1976
0.223
-0.182
-44.93%
jan 1, 1977
0.246
+0.023
10.15%
jan 1, 1978
0.38
+0.134
54.37%
jan 1, 1979
0.733
+0.353
92.82%
jan 1, 1980
0.25
-0.483
-65.91%
jan 1, 1981
0.161
-0.089
-35.73%
jan 1, 1982
0.175
+0.014
8.95%
jan 1, 1983
0.127
-0.048
-27.3%
jan 1, 1984
0.195
+0.068
53.19%
jan 1, 1985
0.327
+0.132
67.66%
jan 1, 1986
0.0
-0.327
-100.0%
jan 1, 1987
0.254
+0.254
%
jan 1, 1988
0.228
-0.026
-10.34%
jan 1, 1989
0.246
+0.018
7.85%
jan 1, 1990
0.179
-0.067
-27.11%
jan 1, 1991
0.143
-0.036
-19.94%
jan 1, 1992
0.172
+0.028
19.71%
jan 1, 1993
0.157
-0.014
-8.38%
jan 1, 1994
0.154
-0.003
-2.18%
jan 1, 1995
0.207
+0.053
34.69%
jan 1, 1996
0.358
+0.151
73.0%
jan 1, 1997
0.601
+0.242
67.53%
jan 1, 1998
0.616
+0.015
2.57%
jan 1, 1999
0.158
-0.458
-74.37%
jan 1, 2000
0.505
+0.347
219.86%
jan 1, 2001
0.398
-0.107
-21.12%
jan 1, 2002
0.309
-0.09
-22.56%
jan 1, 2003
0.509
+0.2
64.9%
jan 1, 2004
0.602
+0.093
18.27%
jan 1, 2005
0.399
-0.203
-33.74%
jan 1, 2006
2.418
+2.02
506.58%
jan 1, 2007
1.184
-1.235
-51.06%
jan 1, 2008
0.704
-0.48
-40.55%
jan 1, 2009
0.961
+0.257
36.59%
jan 1, 2010
1.099
+0.138
14.32%
jan 1, 2011
0.785
-0.314
-28.56%
jan 1, 2012
15.406
+14.621
1.86K%
jan 1, 2013
1.246
-14.16
-91.91%
jan 1, 2014
0.504
-0.742
-59.54%
jan 1, 2015
0.683
+0.179
35.56%
Ranking of countries by current statistics by years


Comments: