29
/
en
AIzaSyAYiBZKx7MnpbEhh9jyipgxe19OcubqV5w
April 1, 2024
30902
Europe & Central Asia
ECS
false
2
1
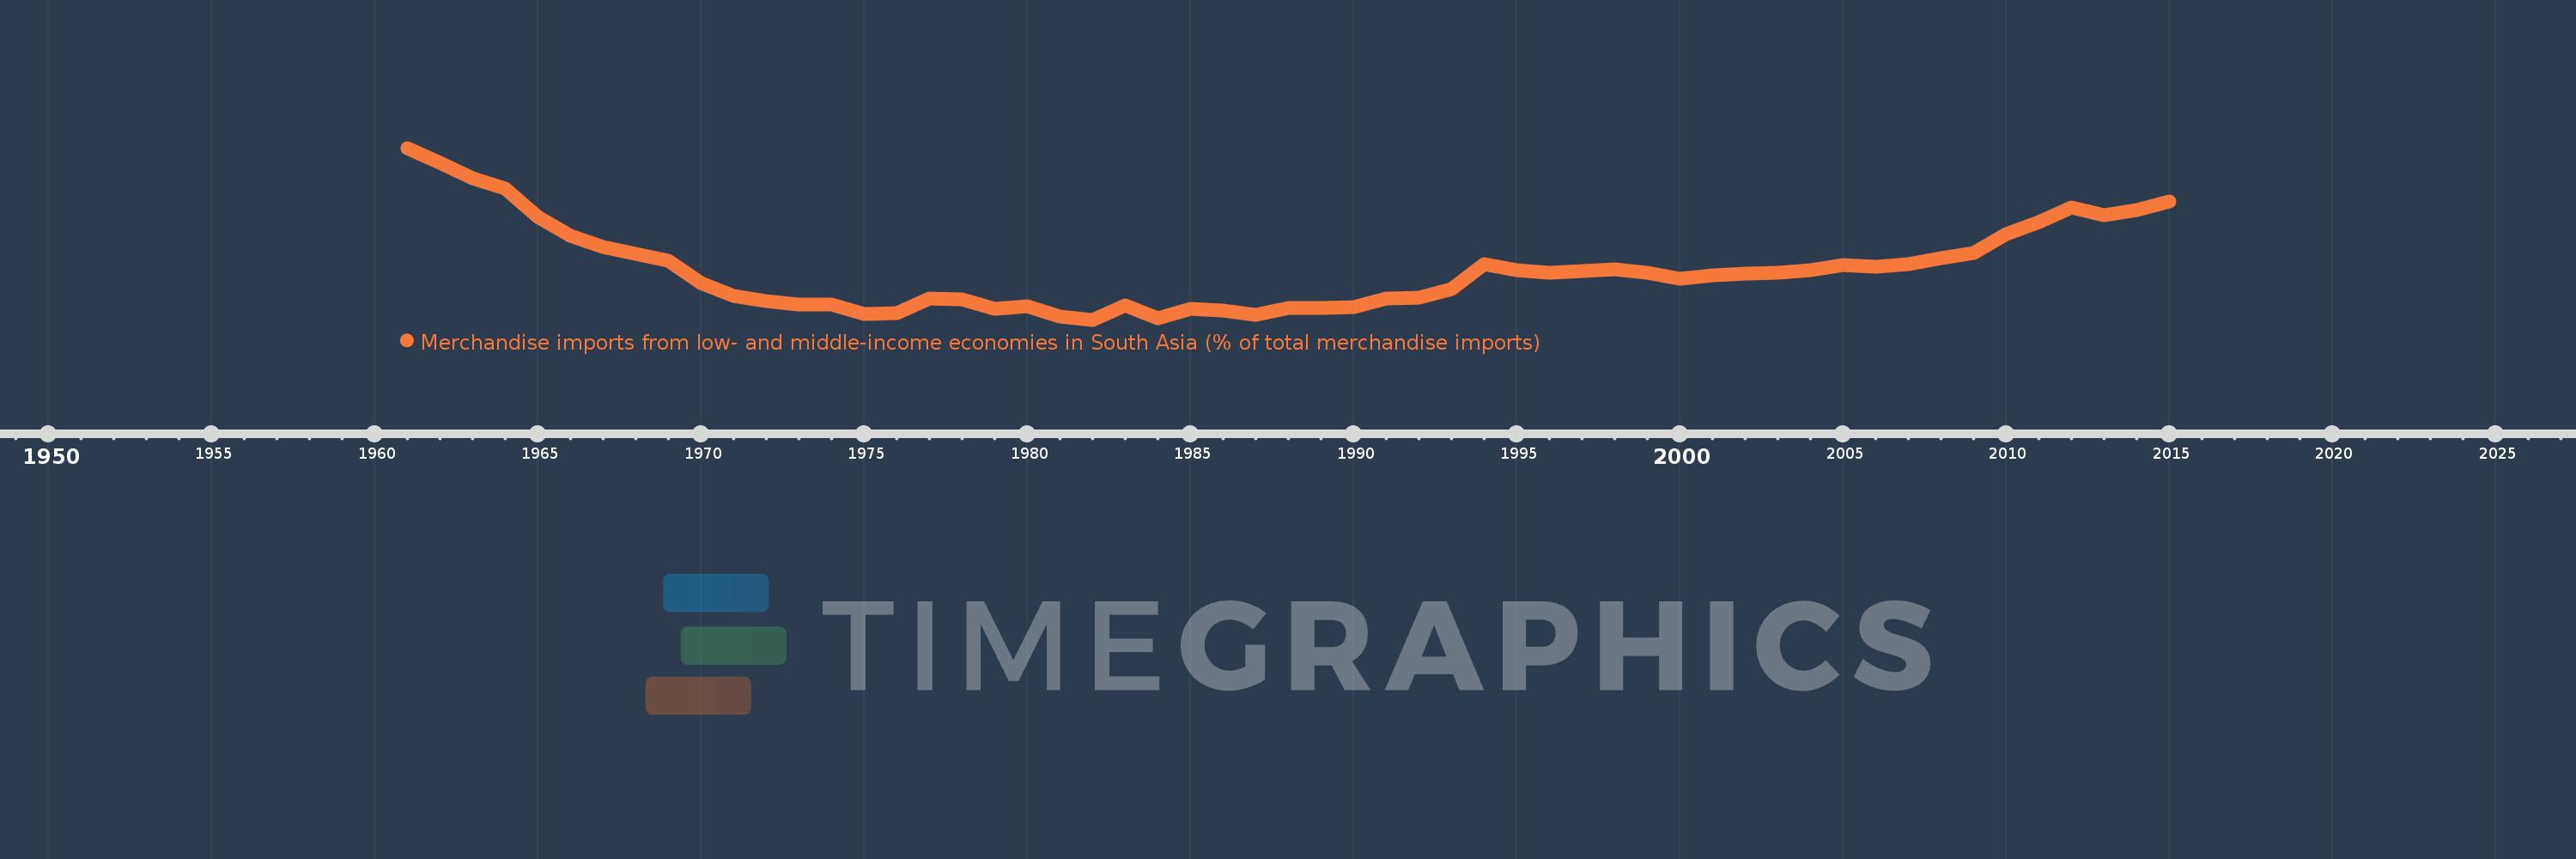
Merchandise imports from low- and middle-income economies in South Asia (% of total merchandise imports)
2015,2014,2013,2012,2011,2010,2009,2008,2007,2006,2005,2004,2003,2002,2001,2000,1999,1998,1997,1996,1995,1994,1993,1992,1991,1990,1989,1988,1987,1986,1985,1984,1983,1982,1981,1980,1979,1978,1977,1976,1975,1974,1973,1972,1971,1970,1969,1968,1967,1966,1965,1964,1963,1962,1961
This statistics in other country:
AfghanistanAlbaniaAlgeriaAngolaAntigua and BarbudaArab WorldArgentinaArmeniaArubaAustraliaAustriaAzerbaijanBahamas, TheBahrainBangladeshBarbadosBelarusBelgiumBelizeBeninBermudaBoliviaBrazilBrunei DarussalamBulgariaBurkina FasoBurundiCabo VerdeCambodiaCameroonCanadaCaribbean small statesCentral African RepublicCentral Europe and the BalticsChadChileChinaColombiaCongo, Dem. Rep.Congo, Rep.Costa RicaCote d'IvoireCroatiaCubaCyprusCzech RepublicDenmarkDjiboutiDominicaDominican RepublicEarly-demographic dividendEast Asia & PacificEast Asia & Pacific (excluding high income)East Asia & Pacific (IDA & IBRD countries)EcuadorEgypt, Arab Rep.El SalvadorEstoniaEthiopiaEuro areaEurope & Central AsiaEurope & Central Asia (excluding high income)Europe & Central Asia (IDA & IBRD countries)European UnionFaroe IslandsFijiFinlandFragile and conflict affected situationsFranceGabonGambia, TheGeorgiaGermanyGhanaGibraltarGreeceGreenlandGrenadaGuatemalaGuineaGuyanaHaitiHeavily indebted poor countries (HIPC)High incomeHondurasHong Kong SAR, ChinaHungaryIBRD onlyIcelandIDA & IBRD totalIDA blendIDA onlyIDA totalIndiaIndonesiaIran, Islamic Rep.IraqIrelandIsraelItalyJamaicaJapanJordanKazakhstanKenyaKiribatiKorea, Dem. People’s Rep.Korea, Rep.KosovoKuwaitKyrgyz RepublicLao PDRLate-demographic dividendLatin America & Caribbean Latin America & Caribbean (excluding high income)Latin America & the Caribbean (IDA & IBRD countries)LatviaLeast developed countries: UN classificationLebanonLiberiaLibyaLithuaniaLow & middle incomeLow incomeLower middle incomeLuxembourgMacao SAR, ChinaMacedonia, FYRMadagascarMalawiMalaysiaMaldivesMaliMaltaMauritaniaMauritiusMexicoMiddle East & North AfricaMiddle East & North Africa (excluding high income)Middle East & North Africa (IDA & IBRD countries)Middle incomeMoldovaMongoliaMontenegroMoroccoMozambiqueMyanmarNauruNepalNetherlandsNew CaledoniaNew ZealandNicaraguaNigerNigeriaNorth AmericaNorwayOECD membersOmanOther small statesPacific island small statesPakistanPanamaPapua New GuineaParaguayPeruPhilippinesPolandPortugalPost-demographic dividendPre-demographic dividendQatarRomaniaRussian FederationRwandaSamoaSaudi ArabiaSenegalSerbiaSeychellesSierra LeoneSingaporeSlovak RepublicSloveniaSmall statesSolomon IslandsSomaliaSouth AfricaSouth AsiaSouth Asia (IDA & IBRD)SpainSri LankaSt. Kitts and NevisSt. LuciaSt. Vincent and the GrenadinesSub-Saharan Africa Sub-Saharan Africa (excluding high income)Sub-Saharan Africa (IDA & IBRD countries)SudanSurinameSwedenSwitzerlandSyrian Arab RepublicTajikistanTanzaniaThailandTogoTongaTrinidad and TobagoTunisiaTurkeyTurkmenistanUgandaUkraineUnited Arab EmiratesUnited KingdomUnited StatesUpper middle incomeUruguayUzbekistanVanuatuVenezuela, RBVietnamWorldYemen, Rep.ZambiaZimbabwe Timeline:
This timeline shows a graph from 1961 to 2015 of Europe & Central Asia. No data until 1960. Number of actual observations by date: 55.
Source name:
World Development Indicators
Source organization:
World Bank staff estimates based data from International Monetary Fund's Direction of Trade database.
Categories, topics:
Private Sector, Trade
Last updated:
apr 23, 2017
Indicators value changes by year
At the date of observation
Value
Absolute change
Change from previous value
jan 1, 1961
1.751
+1.751
0.0%
jan 1, 1962
1.641
-0.11
-6.28%
jan 1, 1963
1.524
-0.118
-7.16%
jan 1, 1964
1.448
-0.076
-4.98%
jan 1, 1965
1.231
-0.217
-14.96%
jan 1, 1966
1.094
-0.138
-11.18%
jan 1, 1967
1.008
-0.086
-7.85%
jan 1, 1968
0.959
-0.048
-4.81%
jan 1, 1969
0.905
-0.054
-5.65%
jan 1, 1970
0.741
-0.164
-18.15%
jan 1, 1971
0.644
-0.097
-13.13%
jan 1, 1972
0.601
-0.043
-6.67%
jan 1, 1973
0.58
-0.02
-3.41%
jan 1, 1974
0.58
-0.001
-0.1%
jan 1, 1975
0.509
-0.07
-12.13%
jan 1, 1976
0.514
+0.004
0.86%
jan 1, 1977
0.619
+0.105
20.53%
jan 1, 1978
0.614
-0.005
-0.77%
jan 1, 1979
0.542
-0.072
-11.69%
jan 1, 1980
0.561
+0.019
3.5%
jan 1, 1981
0.485
-0.077
-13.67%
jan 1, 1982
0.463
-0.022
-4.49%
jan 1, 1983
0.572
+0.109
23.46%
jan 1, 1984
0.471
-0.1
-17.55%
jan 1, 1985
0.544
+0.073
15.41%
jan 1, 1986
0.532
-0.012
-2.25%
jan 1, 1987
0.5
-0.032
-6.0%
jan 1, 1988
0.549
+0.049
9.9%
jan 1, 1989
0.552
+0.003
0.52%
jan 1, 1990
0.557
+0.005
0.93%
jan 1, 1991
0.621
+0.063
11.36%
jan 1, 1992
0.629
+0.008
1.31%
jan 1, 1993
0.696
+0.067
10.72%
jan 1, 1994
0.88
+0.183
26.35%
jan 1, 1995
0.834
-0.046
-5.19%
jan 1, 1996
0.813
-0.02
-2.45%
jan 1, 1997
0.83
+0.017
2.08%
jan 1, 1998
0.84
+0.009
1.11%
jan 1, 1999
0.816
-0.024
-2.83%
jan 1, 2000
0.768
-0.048
-5.83%
jan 1, 2001
0.796
+0.028
3.6%
jan 1, 2002
0.81
+0.014
1.72%
jan 1, 2003
0.816
+0.006
0.75%
jan 1, 2004
0.832
+0.017
2.03%
jan 1, 2005
0.872
+0.039
4.72%
jan 1, 2006
0.861
-0.011
-1.22%
jan 1, 2007
0.878
+0.017
2.03%
jan 1, 2008
0.924
+0.046
5.23%
jan 1, 2009
0.965
+0.041
4.45%
jan 1, 2010
1.102
+0.136
14.13%
jan 1, 2011
1.195
+0.093
8.43%
jan 1, 2012
1.305
+0.11
9.25%
jan 1, 2013
1.244
-0.061
-4.68%
jan 1, 2014
1.288
+0.043
3.48%
jan 1, 2015
1.349
+0.062
4.78%
Ranking of countries by current statistics by years


Comments: