29
/
en
AIzaSyAYiBZKx7MnpbEhh9jyipgxe19OcubqV5w
April 1, 2024
256603
Sweden
SWE
true
2
1
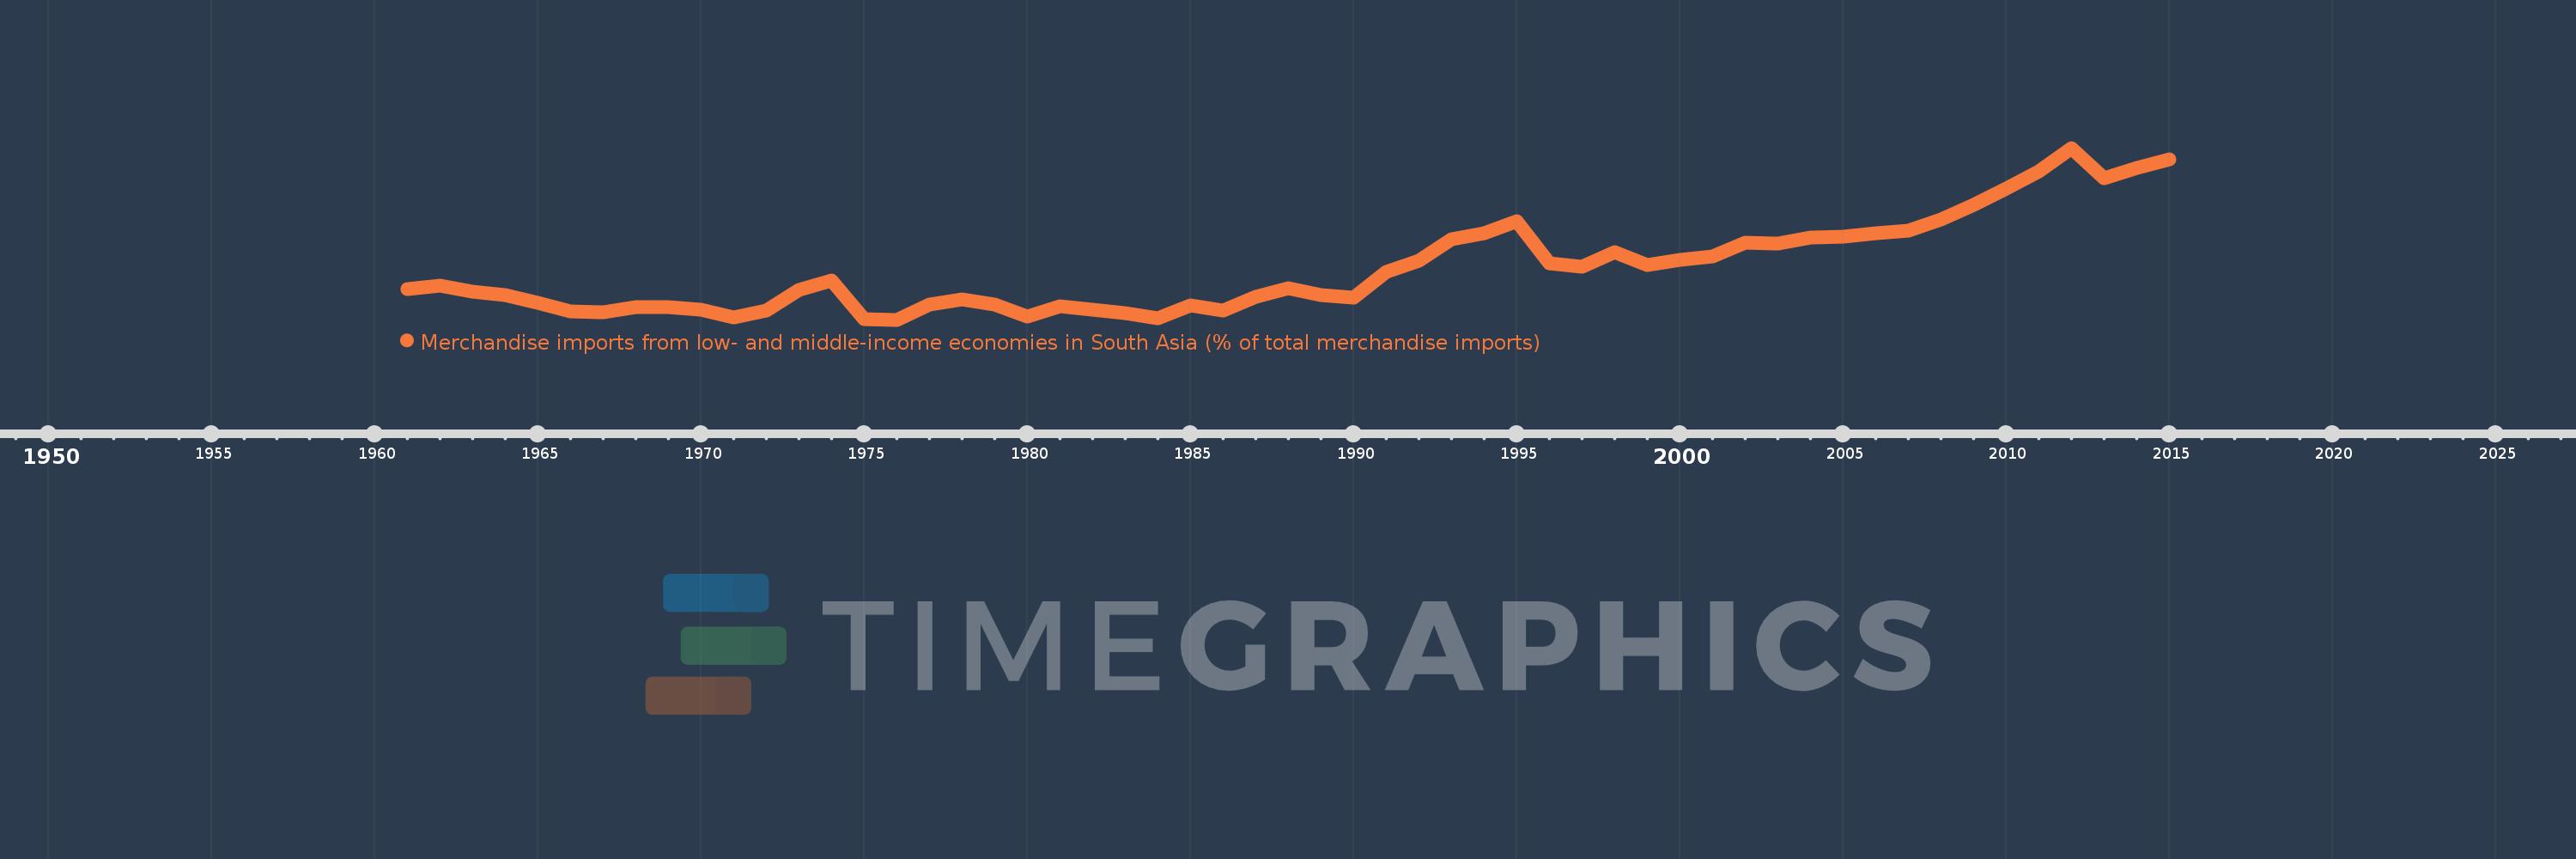
Merchandise imports from low- and middle-income economies in South Asia (% of total merchandise imports)
2015,2014,2013,2012,2011,2010,2009,2008,2007,2006,2005,2004,2003,2002,2001,2000,1999,1998,1997,1996,1995,1994,1993,1992,1991,1990,1989,1988,1987,1986,1985,1984,1983,1982,1981,1980,1979,1978,1977,1976,1975,1974,1973,1972,1971,1970,1969,1968,1967,1966,1965,1964,1963,1962,1961
This statistics in other country:
AfghanistanAlbaniaAlgeriaAngolaAntigua and BarbudaArab WorldArgentinaArmeniaArubaAustraliaAustriaAzerbaijanBahamas, TheBahrainBangladeshBarbadosBelarusBelgiumBelizeBeninBermudaBoliviaBrazilBrunei DarussalamBulgariaBurkina FasoBurundiCabo VerdeCambodiaCameroonCanadaCaribbean small statesCentral African RepublicCentral Europe and the BalticsChadChileChinaColombiaCongo, Dem. Rep.Congo, Rep.Costa RicaCote d'IvoireCroatiaCubaCyprusCzech RepublicDenmarkDjiboutiDominicaDominican RepublicEarly-demographic dividendEast Asia & PacificEast Asia & Pacific (excluding high income)East Asia & Pacific (IDA & IBRD countries)EcuadorEgypt, Arab Rep.El SalvadorEstoniaEthiopiaEuro areaEurope & Central AsiaEurope & Central Asia (excluding high income)Europe & Central Asia (IDA & IBRD countries)European UnionFaroe IslandsFijiFinlandFragile and conflict affected situationsFranceGabonGambia, TheGeorgiaGermanyGhanaGibraltarGreeceGreenlandGrenadaGuatemalaGuineaGuyanaHaitiHeavily indebted poor countries (HIPC)High incomeHondurasHong Kong SAR, ChinaHungaryIBRD onlyIcelandIDA & IBRD totalIDA blendIDA onlyIDA totalIndiaIndonesiaIran, Islamic Rep.IraqIrelandIsraelItalyJamaicaJapanJordanKazakhstanKenyaKiribatiKorea, Dem. People’s Rep.Korea, Rep.KosovoKuwaitKyrgyz RepublicLao PDRLate-demographic dividendLatin America & Caribbean Latin America & Caribbean (excluding high income)Latin America & the Caribbean (IDA & IBRD countries)LatviaLeast developed countries: UN classificationLebanonLiberiaLibyaLithuaniaLow & middle incomeLow incomeLower middle incomeLuxembourgMacao SAR, ChinaMacedonia, FYRMadagascarMalawiMalaysiaMaldivesMaliMaltaMauritaniaMauritiusMexicoMiddle East & North AfricaMiddle East & North Africa (excluding high income)Middle East & North Africa (IDA & IBRD countries)Middle incomeMoldovaMongoliaMontenegroMoroccoMozambiqueMyanmarNauruNepalNetherlandsNew CaledoniaNew ZealandNicaraguaNigerNigeriaNorth AmericaNorwayOECD membersOmanOther small statesPacific island small statesPakistanPanamaPapua New GuineaParaguayPeruPhilippinesPolandPortugalPost-demographic dividendPre-demographic dividendQatarRomaniaRussian FederationRwandaSamoaSaudi ArabiaSenegalSerbiaSeychellesSierra LeoneSingaporeSlovak RepublicSloveniaSmall statesSolomon IslandsSomaliaSouth AfricaSouth AsiaSouth Asia (IDA & IBRD)SpainSri LankaSt. Kitts and NevisSt. LuciaSt. Vincent and the GrenadinesSub-Saharan Africa Sub-Saharan Africa (excluding high income)Sub-Saharan Africa (IDA & IBRD countries)SudanSurinameSwedenSwitzerlandSyrian Arab RepublicTajikistanTanzaniaThailandTogoTongaTrinidad and TobagoTunisiaTurkeyTurkmenistanUgandaUkraineUnited Arab EmiratesUnited KingdomUnited StatesUpper middle incomeUruguayUzbekistanVanuatuVenezuela, RBVietnamWorldYemen, Rep.ZambiaZimbabwe Timeline:
This timeline shows a graph from 1961 to 2015 of Sweden. No data until 1960. Number of actual observations by date: 55.
Source name:
World Development Indicators
Source organization:
World Bank staff estimates based data from International Monetary Fund's Direction of Trade database.
Categories, topics:
Private Sector, Trade
Last updated:
apr 23, 2017
Indicators value changes by year
At the date of observation
Value
Absolute change
Change from previous value
jan 1, 1961
0.395
+0.395
0.0%
jan 1, 1962
0.408
+0.013
3.2%
jan 1, 1963
0.386
-0.022
-5.35%
jan 1, 1964
0.372
-0.014
-3.64%
jan 1, 1965
0.346
-0.025
-6.81%
jan 1, 1966
0.314
-0.032
-9.37%
jan 1, 1967
0.313
-0.001
-0.31%
jan 1, 1968
0.332
+0.019
6.08%
jan 1, 1969
0.33
-0.002
-0.54%
jan 1, 1970
0.32
-0.01
-3.05%
jan 1, 1971
0.294
-0.026
-8.15%
jan 1, 1972
0.317
+0.022
7.65%
jan 1, 1973
0.391
+0.074
23.43%
jan 1, 1974
0.425
+0.035
8.87%
jan 1, 1975
0.289
-0.137
-32.15%
jan 1, 1976
0.286
-0.002
-0.85%
jan 1, 1977
0.339
+0.053
18.56%
jan 1, 1978
0.359
+0.02
5.79%
jan 1, 1979
0.341
-0.017
-4.87%
jan 1, 1980
0.298
-0.043
-12.66%
jan 1, 1981
0.333
+0.035
11.74%
jan 1, 1982
0.32
-0.013
-3.99%
jan 1, 1983
0.31
-0.01
-3.02%
jan 1, 1984
0.29
-0.02
-6.52%
jan 1, 1985
0.338
+0.048
16.66%
jan 1, 1986
0.318
-0.021
-6.08%
jan 1, 1987
0.368
+0.05
15.82%
jan 1, 1988
0.398
+0.03
8.23%
jan 1, 1989
0.374
-0.024
-6.04%
jan 1, 1990
0.364
-0.01
-2.74%
jan 1, 1991
0.456
+0.092
25.27%
jan 1, 1992
0.495
+0.039
8.63%
jan 1, 1993
0.57
+0.074
15.03%
jan 1, 1994
0.593
+0.023
4.06%
jan 1, 1995
0.635
+0.042
7.13%
jan 1, 1996
0.485
-0.15
-23.59%
jan 1, 1997
0.474
-0.012
-2.38%
jan 1, 1998
0.524
+0.05
10.61%
jan 1, 1999
0.48
-0.044
-8.34%
jan 1, 2000
0.499
+0.018
3.8%
jan 1, 2001
0.511
+0.012
2.37%
jan 1, 2002
0.557
+0.047
9.14%
jan 1, 2003
0.554
-0.003
-0.54%
jan 1, 2004
0.577
+0.023
4.1%
jan 1, 2005
0.58
+0.003
0.49%
jan 1, 2006
0.592
+0.012
2.16%
jan 1, 2007
0.6
+0.007
1.24%
jan 1, 2008
0.64
+0.04
6.7%
jan 1, 2009
0.693
+0.053
8.24%
jan 1, 2010
0.75
+0.057
8.29%
jan 1, 2011
0.809
+0.059
7.87%
jan 1, 2012
0.893
+0.084
10.35%
jan 1, 2013
0.786
-0.107
-12.01%
jan 1, 2014
0.822
+0.036
4.59%
jan 1, 2015
0.852
+0.03
3.65%
Ranking of countries by current statistics by years


Comments: