29
/
en
AIzaSyAYiBZKx7MnpbEhh9jyipgxe19OcubqV5w
April 1, 2024
287494
Zimbabwe
ZWE
true
2
1
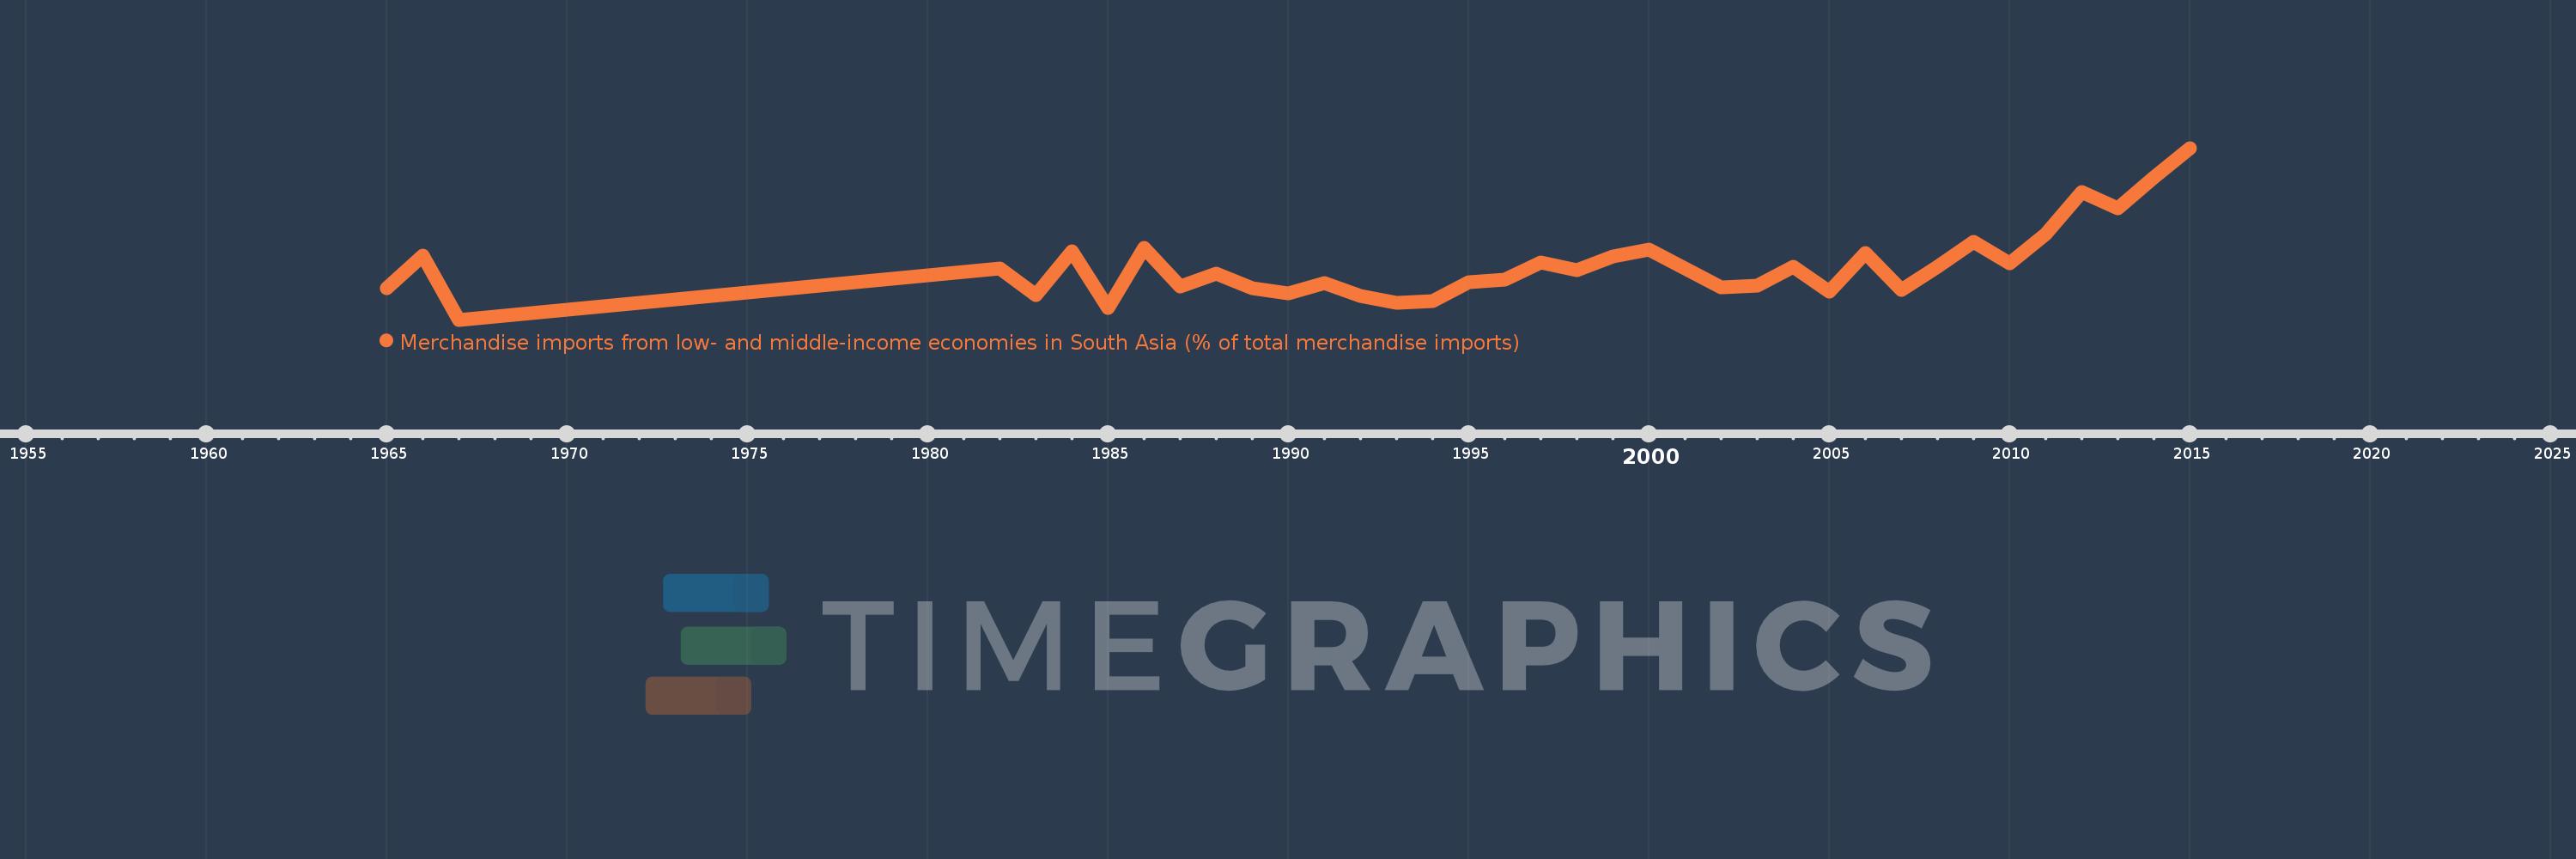
Merchandise imports from low- and middle-income economies in South Asia (% of total merchandise imports)
2015,2014,2013,2012,2011,2010,2009,2008,2007,2006,2005,2004,2003,2002,2001,2000,1999,1998,1997,1996,1995,1994,1993,1992,1991,1990,1989,1988,1987,1986,1985,1984,1983,1982,1967,1966,1965
This statistics in other country:
AfghanistanAlbaniaAlgeriaAngolaAntigua and BarbudaArab WorldArgentinaArmeniaArubaAustraliaAustriaAzerbaijanBahamas, TheBahrainBangladeshBarbadosBelarusBelgiumBelizeBeninBermudaBoliviaBrazilBrunei DarussalamBulgariaBurkina FasoBurundiCabo VerdeCambodiaCameroonCanadaCaribbean small statesCentral African RepublicCentral Europe and the BalticsChadChileChinaColombiaCongo, Dem. Rep.Congo, Rep.Costa RicaCote d'IvoireCroatiaCubaCyprusCzech RepublicDenmarkDjiboutiDominicaDominican RepublicEarly-demographic dividendEast Asia & PacificEast Asia & Pacific (excluding high income)East Asia & Pacific (IDA & IBRD countries)EcuadorEgypt, Arab Rep.El SalvadorEstoniaEthiopiaEuro areaEurope & Central AsiaEurope & Central Asia (excluding high income)Europe & Central Asia (IDA & IBRD countries)European UnionFaroe IslandsFijiFinlandFragile and conflict affected situationsFranceGabonGambia, TheGeorgiaGermanyGhanaGibraltarGreeceGreenlandGrenadaGuatemalaGuineaGuyanaHaitiHeavily indebted poor countries (HIPC)High incomeHondurasHong Kong SAR, ChinaHungaryIBRD onlyIcelandIDA & IBRD totalIDA blendIDA onlyIDA totalIndiaIndonesiaIran, Islamic Rep.IraqIrelandIsraelItalyJamaicaJapanJordanKazakhstanKenyaKiribatiKorea, Dem. People’s Rep.Korea, Rep.KosovoKuwaitKyrgyz RepublicLao PDRLate-demographic dividendLatin America & Caribbean Latin America & Caribbean (excluding high income)Latin America & the Caribbean (IDA & IBRD countries)LatviaLeast developed countries: UN classificationLebanonLiberiaLibyaLithuaniaLow & middle incomeLow incomeLower middle incomeLuxembourgMacao SAR, ChinaMacedonia, FYRMadagascarMalawiMalaysiaMaldivesMaliMaltaMauritaniaMauritiusMexicoMiddle East & North AfricaMiddle East & North Africa (excluding high income)Middle East & North Africa (IDA & IBRD countries)Middle incomeMoldovaMongoliaMontenegroMoroccoMozambiqueMyanmarNauruNepalNetherlandsNew CaledoniaNew ZealandNicaraguaNigerNigeriaNorth AmericaNorwayOECD membersOmanOther small statesPacific island small statesPakistanPanamaPapua New GuineaParaguayPeruPhilippinesPolandPortugalPost-demographic dividendPre-demographic dividendQatarRomaniaRussian FederationRwandaSamoaSaudi ArabiaSenegalSerbiaSeychellesSierra LeoneSingaporeSlovak RepublicSloveniaSmall statesSolomon IslandsSomaliaSouth AfricaSouth AsiaSouth Asia (IDA & IBRD)SpainSri LankaSt. Kitts and NevisSt. LuciaSt. Vincent and the GrenadinesSub-Saharan Africa Sub-Saharan Africa (excluding high income)Sub-Saharan Africa (IDA & IBRD countries)SudanSurinameSwedenSwitzerlandSyrian Arab RepublicTajikistanTanzaniaThailandTogoTongaTrinidad and TobagoTunisiaTurkeyTurkmenistanUgandaUkraineUnited Arab EmiratesUnited KingdomUnited StatesUpper middle incomeUruguayUzbekistanVanuatuVenezuela, RBVietnamWorldYemen, Rep.ZambiaZimbabwe Timeline:
This timeline shows a graph from 1965 to 2015 of Zimbabwe. No data until 1964. Number of actual observations by date: 37.
Source name:
World Development Indicators
Source organization:
World Bank staff estimates based data from International Monetary Fund's Direction of Trade database.
Categories, topics:
Private Sector, Trade
Last updated:
apr 23, 2017
Indicators value changes by year
At the date of observation
Value
Absolute change
Change from previous value
jan 1, 1965
0.816
+0.816
0.0%
jan 1, 1966
1.681
+0.865
105.91%
jan 1, 1967
0.0
-1.681
-100.0%
jan 1, 1982
1.338
+1.338
%
jan 1, 1983
0.634
-0.704
-52.6%
jan 1, 1984
1.779
+1.145
180.49%
jan 1, 1985
0.298
-1.48
-83.23%
jan 1, 1986
1.882
+1.583
530.91%
jan 1, 1987
0.859
-1.023
-54.35%
jan 1, 1988
1.205
+0.346
40.29%
jan 1, 1989
0.813
-0.392
-32.49%
jan 1, 1990
0.688
-0.126
-15.44%
jan 1, 1991
0.954
+0.267
38.75%
jan 1, 1992
0.615
-0.339
-35.55%
jan 1, 1993
0.433
-0.182
-29.56%
jan 1, 1994
0.483
+0.05
11.44%
jan 1, 1995
0.971
+0.488
101.09%
jan 1, 1996
1.044
+0.073
7.51%
jan 1, 1997
1.49
+0.446
42.75%
jan 1, 1998
1.289
-0.201
-13.5%
jan 1, 1999
1.645
+0.356
27.6%
jan 1, 2000
1.833
+0.188
11.42%
jan 1, 2001
1.339
-0.494
-26.96%
jan 1, 2002
0.853
-0.485
-36.25%
jan 1, 2003
0.89
+0.037
4.3%
jan 1, 2004
1.392
+0.502
56.36%
jan 1, 2005
0.737
-0.655
-47.06%
jan 1, 2006
1.743
+1.006
136.57%
jan 1, 2007
0.786
-0.957
-54.91%
jan 1, 2008
1.384
+0.599
76.16%
jan 1, 2009
2.036
+0.652
47.06%
jan 1, 2010
1.474
-0.562
-27.61%
jan 1, 2011
2.24
+0.767
52.01%
jan 1, 2012
3.34
+1.1
49.08%
jan 1, 2013
2.909
-0.431
-12.9%
jan 1, 2014
3.719
+0.809
27.82%
jan 1, 2015
4.488
+0.77
20.7%
Ranking of countries by current statistics by years


Comments: