29
/
en
AIzaSyAYiBZKx7MnpbEhh9jyipgxe19OcubqV5w
April 1, 2024
201872
Morocco
MAR
true
2
1
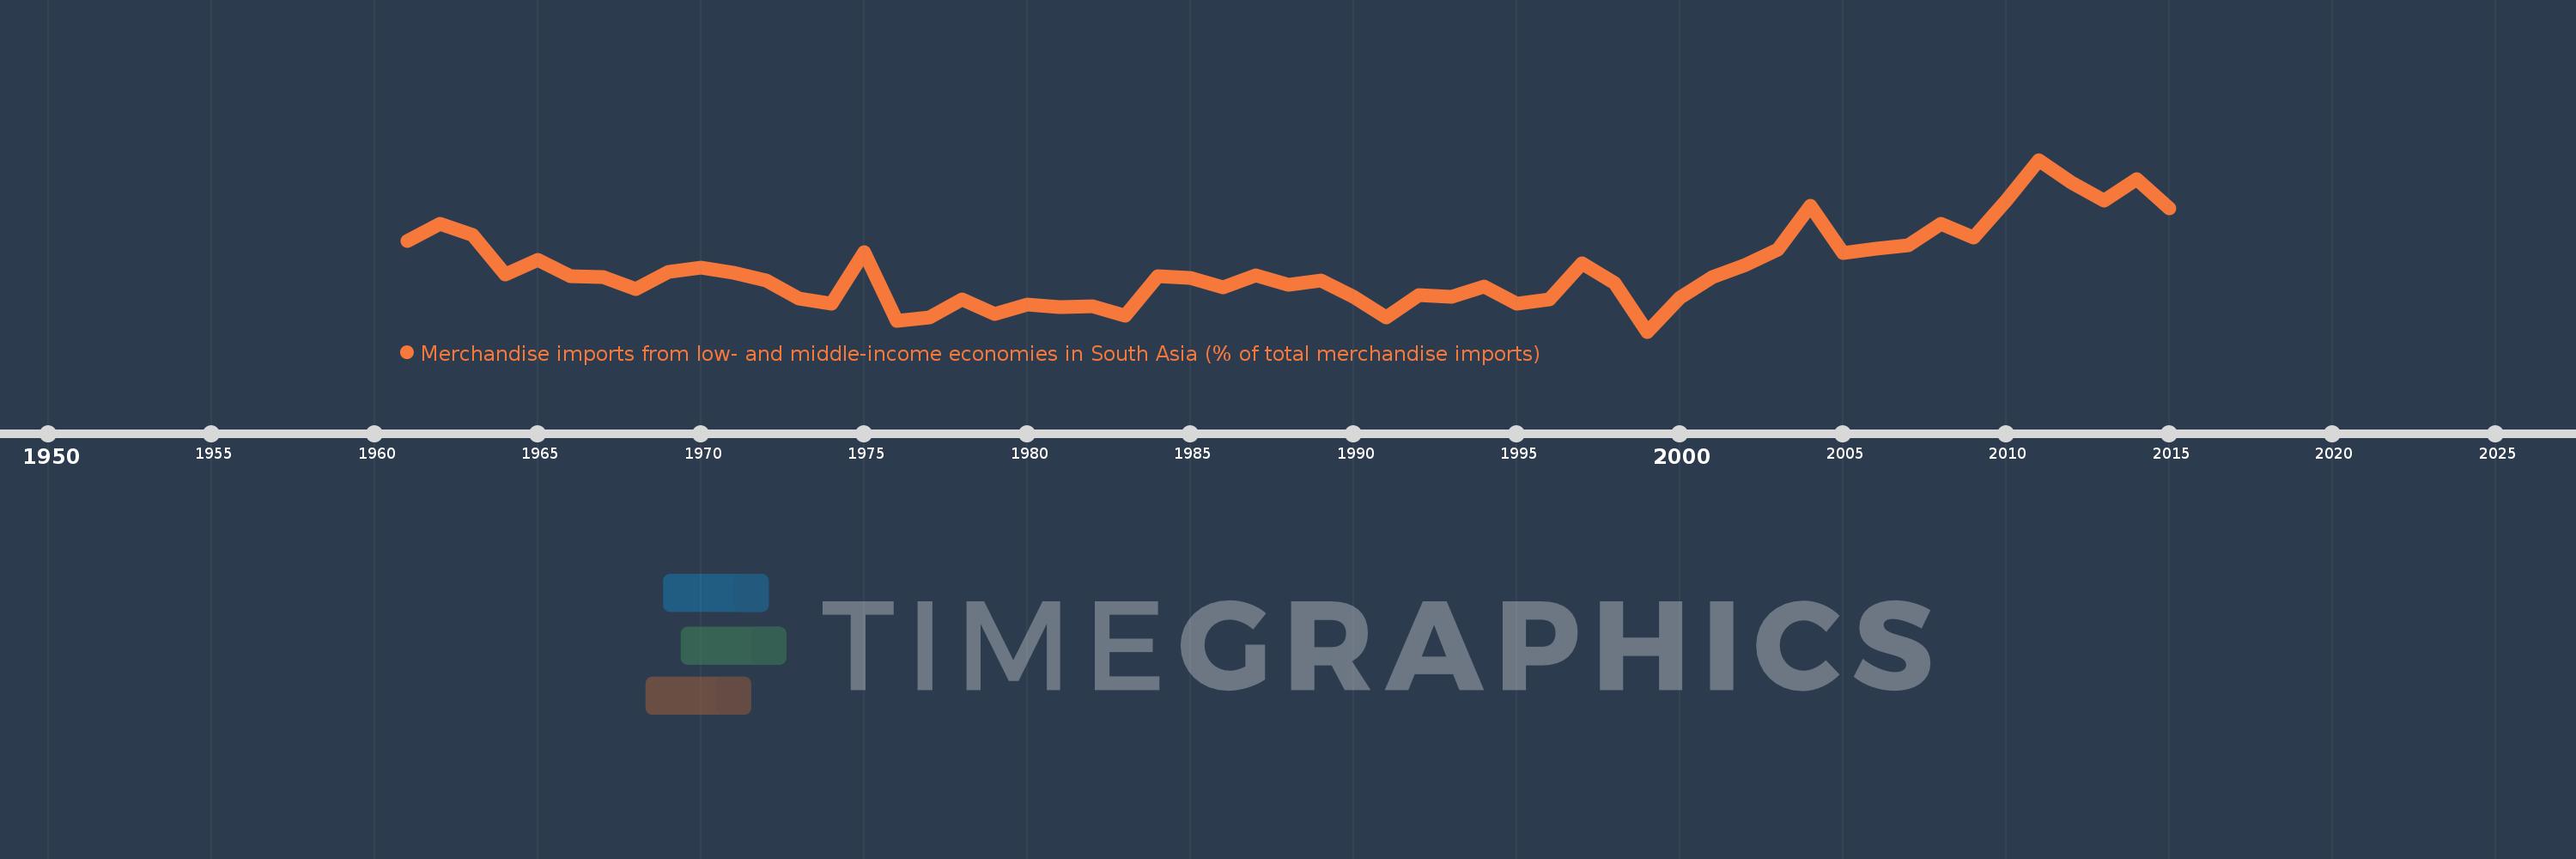
Merchandise imports from low- and middle-income economies in South Asia (% of total merchandise imports)
2015,2014,2013,2012,2011,2010,2009,2008,2007,2006,2005,2004,2003,2002,2001,2000,1999,1998,1997,1996,1995,1994,1993,1992,1991,1990,1989,1988,1987,1986,1985,1984,1983,1982,1981,1980,1979,1978,1977,1976,1975,1974,1973,1972,1971,1970,1969,1968,1967,1966,1965,1964,1963,1962,1961
This statistics in other country:
AfghanistanAlbaniaAlgeriaAngolaAntigua and BarbudaArab WorldArgentinaArmeniaArubaAustraliaAustriaAzerbaijanBahamas, TheBahrainBangladeshBarbadosBelarusBelgiumBelizeBeninBermudaBoliviaBrazilBrunei DarussalamBulgariaBurkina FasoBurundiCabo VerdeCambodiaCameroonCanadaCaribbean small statesCentral African RepublicCentral Europe and the BalticsChadChileChinaColombiaCongo, Dem. Rep.Congo, Rep.Costa RicaCote d'IvoireCroatiaCubaCyprusCzech RepublicDenmarkDjiboutiDominicaDominican RepublicEarly-demographic dividendEast Asia & PacificEast Asia & Pacific (excluding high income)East Asia & Pacific (IDA & IBRD countries)EcuadorEgypt, Arab Rep.El SalvadorEstoniaEthiopiaEuro areaEurope & Central AsiaEurope & Central Asia (excluding high income)Europe & Central Asia (IDA & IBRD countries)European UnionFaroe IslandsFijiFinlandFragile and conflict affected situationsFranceGabonGambia, TheGeorgiaGermanyGhanaGibraltarGreeceGreenlandGrenadaGuatemalaGuineaGuyanaHaitiHeavily indebted poor countries (HIPC)High incomeHondurasHong Kong SAR, ChinaHungaryIBRD onlyIcelandIDA & IBRD totalIDA blendIDA onlyIDA totalIndiaIndonesiaIran, Islamic Rep.IraqIrelandIsraelItalyJamaicaJapanJordanKazakhstanKenyaKiribatiKorea, Dem. People’s Rep.Korea, Rep.KosovoKuwaitKyrgyz RepublicLao PDRLate-demographic dividendLatin America & Caribbean Latin America & Caribbean (excluding high income)Latin America & the Caribbean (IDA & IBRD countries)LatviaLeast developed countries: UN classificationLebanonLiberiaLibyaLithuaniaLow & middle incomeLow incomeLower middle incomeLuxembourgMacao SAR, ChinaMacedonia, FYRMadagascarMalawiMalaysiaMaldivesMaliMaltaMauritaniaMauritiusMexicoMiddle East & North AfricaMiddle East & North Africa (excluding high income)Middle East & North Africa (IDA & IBRD countries)Middle incomeMoldovaMongoliaMontenegroMoroccoMozambiqueMyanmarNauruNepalNetherlandsNew CaledoniaNew ZealandNicaraguaNigerNigeriaNorth AmericaNorwayOECD membersOmanOther small statesPacific island small statesPakistanPanamaPapua New GuineaParaguayPeruPhilippinesPolandPortugalPost-demographic dividendPre-demographic dividendQatarRomaniaRussian FederationRwandaSamoaSaudi ArabiaSenegalSerbiaSeychellesSierra LeoneSingaporeSlovak RepublicSloveniaSmall statesSolomon IslandsSomaliaSouth AfricaSouth AsiaSouth Asia (IDA & IBRD)SpainSri LankaSt. Kitts and NevisSt. LuciaSt. Vincent and the GrenadinesSub-Saharan Africa Sub-Saharan Africa (excluding high income)Sub-Saharan Africa (IDA & IBRD countries)SudanSurinameSwedenSwitzerlandSyrian Arab RepublicTajikistanTanzaniaThailandTogoTongaTrinidad and TobagoTunisiaTurkeyTurkmenistanUgandaUkraineUnited Arab EmiratesUnited KingdomUnited StatesUpper middle incomeUruguayUzbekistanVanuatuVenezuela, RBVietnamWorldYemen, Rep.ZambiaZimbabwe Timeline:
This timeline shows a graph from 1961 to 2015 of Morocco. No data until 1960. Number of actual observations by date: 55.
Source name:
World Development Indicators
Source organization:
World Bank staff estimates based data from International Monetary Fund's Direction of Trade database.
Categories, topics:
Private Sector, Trade
Last updated:
apr 23, 2017
Indicators value changes by year
At the date of observation
Value
Absolute change
Change from previous value
jan 1, 1961
0.903
+0.903
0.0%
jan 1, 1962
1.078
+0.175
19.39%
jan 1, 1963
0.962
-0.116
-10.73%
jan 1, 1964
0.569
-0.393
-40.87%
jan 1, 1965
0.721
+0.152
26.72%
jan 1, 1966
0.556
-0.165
-22.93%
jan 1, 1967
0.543
-0.013
-2.34%
jan 1, 1968
0.425
-0.118
-21.71%
jan 1, 1969
0.598
+0.173
40.66%
jan 1, 1970
0.637
+0.039
6.53%
jan 1, 1971
0.591
-0.046
-7.23%
jan 1, 1972
0.51
-0.08
-13.6%
jan 1, 1973
0.331
-0.179
-35.11%
jan 1, 1974
0.28
-0.052
-15.56%
jan 1, 1975
0.79
+0.51
182.51%
jan 1, 1976
0.11
-0.68
-86.05%
jan 1, 1977
0.14
+0.029
26.64%
jan 1, 1978
0.318
+0.178
127.63%
jan 1, 1979
0.18
-0.137
-43.25%
jan 1, 1980
0.271
+0.091
50.51%
jan 1, 1981
0.247
-0.024
-9.03%
jan 1, 1982
0.249
+0.002
0.79%
jan 1, 1983
0.158
-0.091
-36.41%
jan 1, 1984
0.552
+0.393
248.59%
jan 1, 1985
0.535
-0.017
-3.08%
jan 1, 1986
0.445
-0.09
-16.77%
jan 1, 1987
0.566
+0.121
27.2%
jan 1, 1988
0.467
-0.099
-17.49%
jan 1, 1989
0.514
+0.047
10.12%
jan 1, 1990
0.347
-0.167
-32.52%
jan 1, 1991
0.142
-0.205
-59.04%
jan 1, 1992
0.365
+0.223
156.77%
jan 1, 1993
0.345
-0.02
-5.6%
jan 1, 1994
0.453
+0.108
31.36%
jan 1, 1995
0.278
-0.175
-38.68%
jan 1, 1996
0.324
+0.047
16.9%
jan 1, 1997
0.681
+0.356
109.85%
jan 1, 1998
0.481
-0.2
-29.42%
jan 1, 1999
0.0
-0.481
-100.0%
jan 1, 2000
0.338
+0.338
%
jan 1, 2001
0.546
+0.208
61.38%
jan 1, 2002
0.669
+0.123
22.48%
jan 1, 2003
0.82
+0.151
22.58%
jan 1, 2004
1.26
+0.44
53.69%
jan 1, 2005
0.789
-0.472
-37.42%
jan 1, 2006
0.829
+0.041
5.16%
jan 1, 2007
0.863
+0.034
4.12%
jan 1, 2008
1.081
+0.217
25.17%
jan 1, 2009
0.94
-0.14
-12.99%
jan 1, 2010
1.311
+0.371
39.45%
jan 1, 2011
1.717
+0.405
30.9%
jan 1, 2012
1.493
-0.224
-13.06%
jan 1, 2013
1.312
-0.18
-12.07%
jan 1, 2014
1.528
+0.215
16.42%
jan 1, 2015
1.235
-0.293
-19.18%
Ranking of countries by current statistics by years


Comments: