29
/
en
AIzaSyAYiBZKx7MnpbEhh9jyipgxe19OcubqV5w
April 1, 2024
95143
Burkina Faso
BFA
true
2
1
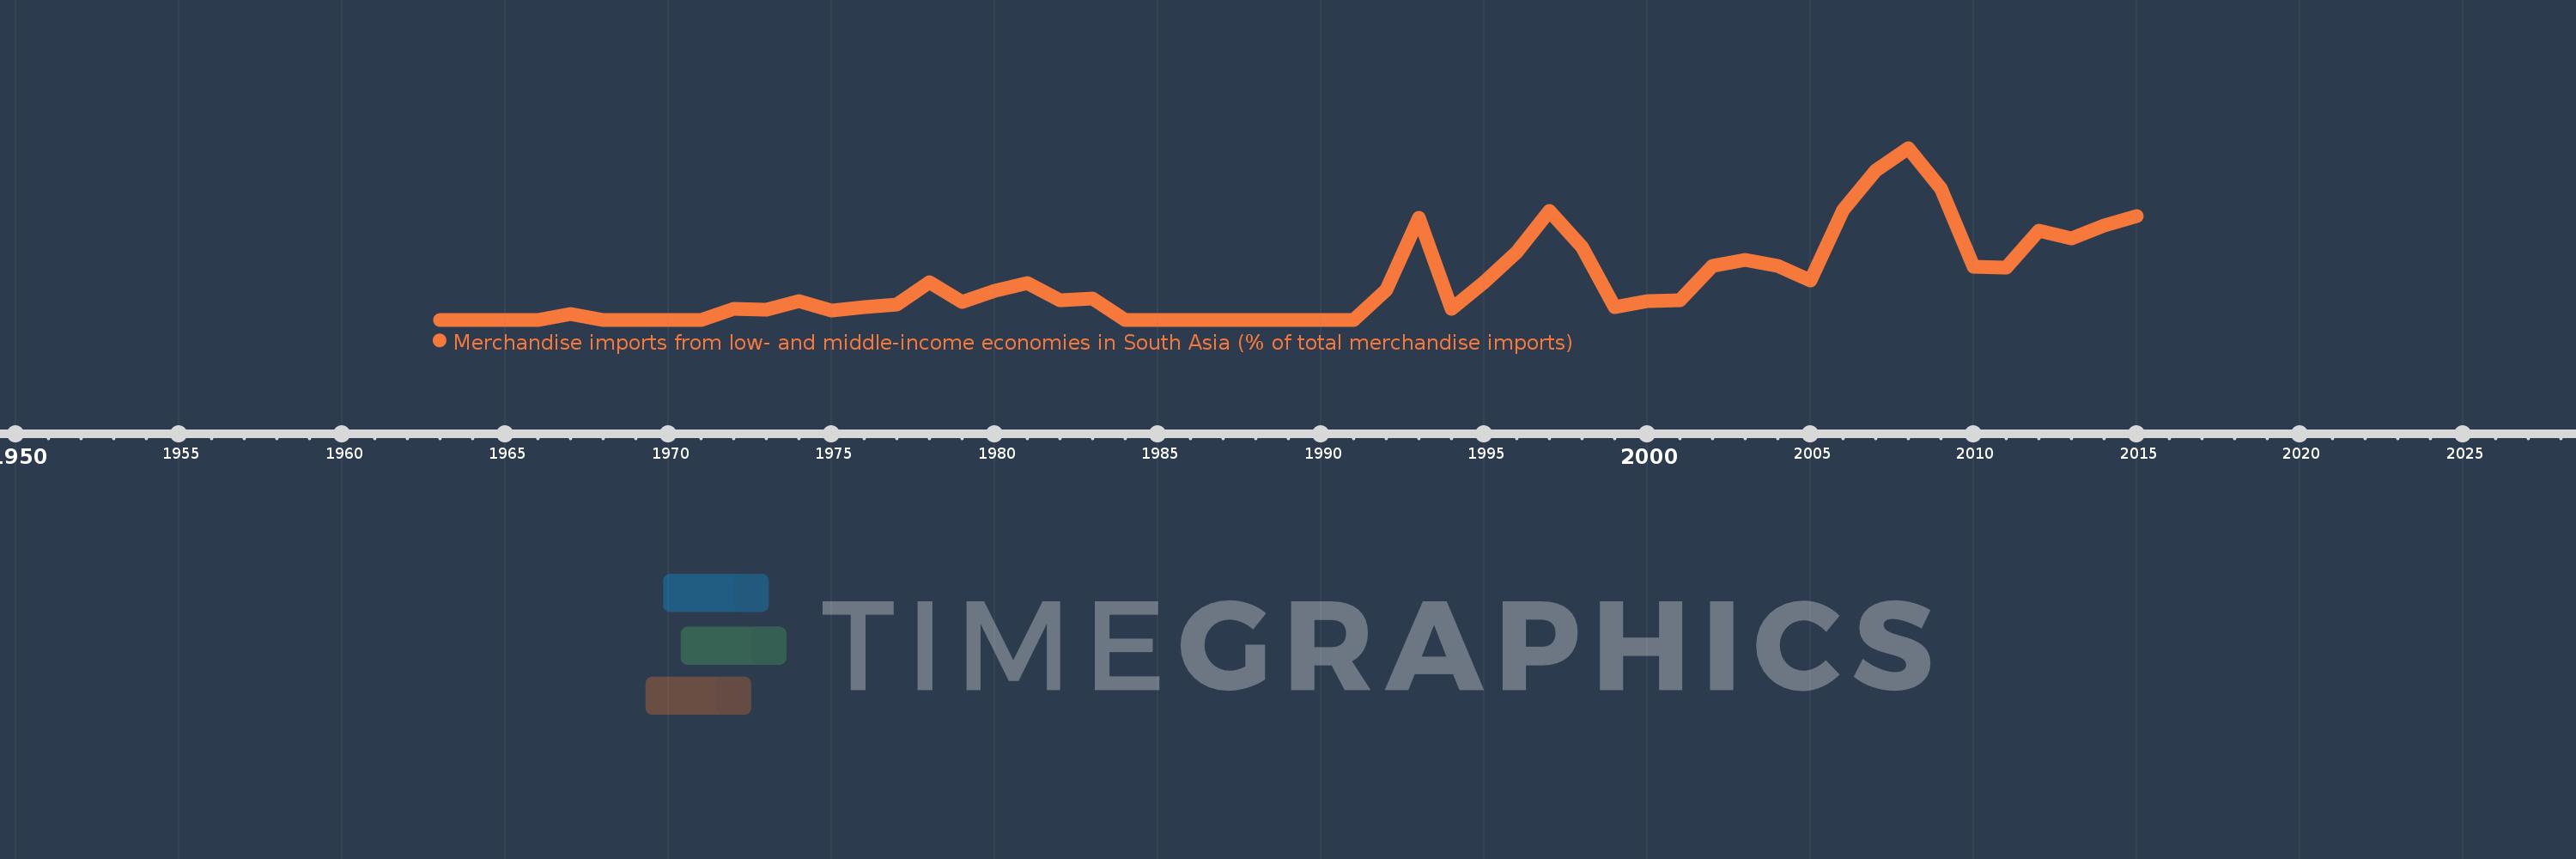
Merchandise imports from low- and middle-income economies in South Asia (% of total merchandise imports)
2015,2014,2013,2012,2011,2010,2009,2008,2007,2006,2005,2004,2003,2002,2001,2000,1999,1998,1997,1996,1995,1994,1993,1992,1991,1990,1989,1988,1987,1986,1985,1984,1983,1982,1981,1980,1979,1978,1977,1976,1975,1974,1973,1972,1971,1970,1969,1968,1967,1966,1965,1964,1963
This statistics in other country:
AfghanistanAlbaniaAlgeriaAngolaAntigua and BarbudaArab WorldArgentinaArmeniaArubaAustraliaAustriaAzerbaijanBahamas, TheBahrainBangladeshBarbadosBelarusBelgiumBelizeBeninBermudaBoliviaBrazilBrunei DarussalamBulgariaBurkina FasoBurundiCabo VerdeCambodiaCameroonCanadaCaribbean small statesCentral African RepublicCentral Europe and the BalticsChadChileChinaColombiaCongo, Dem. Rep.Congo, Rep.Costa RicaCote d'IvoireCroatiaCubaCyprusCzech RepublicDenmarkDjiboutiDominicaDominican RepublicEarly-demographic dividendEast Asia & PacificEast Asia & Pacific (excluding high income)East Asia & Pacific (IDA & IBRD countries)EcuadorEgypt, Arab Rep.El SalvadorEstoniaEthiopiaEuro areaEurope & Central AsiaEurope & Central Asia (excluding high income)Europe & Central Asia (IDA & IBRD countries)European UnionFaroe IslandsFijiFinlandFragile and conflict affected situationsFranceGabonGambia, TheGeorgiaGermanyGhanaGibraltarGreeceGreenlandGrenadaGuatemalaGuineaGuyanaHaitiHeavily indebted poor countries (HIPC)High incomeHondurasHong Kong SAR, ChinaHungaryIBRD onlyIcelandIDA & IBRD totalIDA blendIDA onlyIDA totalIndiaIndonesiaIran, Islamic Rep.IraqIrelandIsraelItalyJamaicaJapanJordanKazakhstanKenyaKiribatiKorea, Dem. People’s Rep.Korea, Rep.KosovoKuwaitKyrgyz RepublicLao PDRLate-demographic dividendLatin America & Caribbean Latin America & Caribbean (excluding high income)Latin America & the Caribbean (IDA & IBRD countries)LatviaLeast developed countries: UN classificationLebanonLiberiaLibyaLithuaniaLow & middle incomeLow incomeLower middle incomeLuxembourgMacao SAR, ChinaMacedonia, FYRMadagascarMalawiMalaysiaMaldivesMaliMaltaMauritaniaMauritiusMexicoMiddle East & North AfricaMiddle East & North Africa (excluding high income)Middle East & North Africa (IDA & IBRD countries)Middle incomeMoldovaMongoliaMontenegroMoroccoMozambiqueMyanmarNauruNepalNetherlandsNew CaledoniaNew ZealandNicaraguaNigerNigeriaNorth AmericaNorwayOECD membersOmanOther small statesPacific island small statesPakistanPanamaPapua New GuineaParaguayPeruPhilippinesPolandPortugalPost-demographic dividendPre-demographic dividendQatarRomaniaRussian FederationRwandaSamoaSaudi ArabiaSenegalSerbiaSeychellesSierra LeoneSingaporeSlovak RepublicSloveniaSmall statesSolomon IslandsSomaliaSouth AfricaSouth AsiaSouth Asia (IDA & IBRD)SpainSri LankaSt. Kitts and NevisSt. LuciaSt. Vincent and the GrenadinesSub-Saharan Africa Sub-Saharan Africa (excluding high income)Sub-Saharan Africa (IDA & IBRD countries)SudanSurinameSwedenSwitzerlandSyrian Arab RepublicTajikistanTanzaniaThailandTogoTongaTrinidad and TobagoTunisiaTurkeyTurkmenistanUgandaUkraineUnited Arab EmiratesUnited KingdomUnited StatesUpper middle incomeUruguayUzbekistanVanuatuVenezuela, RBVietnamWorldYemen, Rep.ZambiaZimbabwe Timeline:
This timeline shows a graph from 1963 to 2015 of Burkina Faso. No data until 1962. Number of actual observations by date: 53.
Source name:
World Development Indicators
Source organization:
World Bank staff estimates based data from International Monetary Fund's Direction of Trade database.
Categories, topics:
Private Sector, Trade
Last updated:
apr 23, 2017
Indicators value changes by year
At the date of observation
Value
Absolute change
Change from previous value
jan 1, 1967
0.267
+0.267
%
jan 1, 1968
0.0
-0.267
-100.0%
jan 1, 1972
0.478
+0.478
%
jan 1, 1973
0.456
-0.022
-4.61%
jan 1, 1974
0.819
+0.363
79.52%
jan 1, 1975
0.391
-0.428
-52.21%
jan 1, 1976
0.57
+0.178
45.59%
jan 1, 1977
0.692
+0.122
21.42%
jan 1, 1978
1.668
+0.976
141.07%
jan 1, 1979
0.793
-0.875
-52.46%
jan 1, 1980
1.284
+0.491
61.95%
jan 1, 1981
1.606
+0.322
25.05%
jan 1, 1982
0.848
-0.758
-47.18%
jan 1, 1983
0.954
+0.106
12.49%
jan 1, 1984
0.0
-0.954
-100.0%
jan 1, 1992
1.322
+1.322
%
jan 1, 1993
4.507
+3.185
241.03%
jan 1, 1994
0.482
-4.025
-89.3%
jan 1, 1995
1.676
+1.193
247.39%
jan 1, 1996
2.987
+1.311
78.21%
jan 1, 1997
4.828
+1.841
61.66%
jan 1, 1998
3.23
-1.599
-33.11%
jan 1, 1999
0.544
-2.686
-83.16%
jan 1, 2000
0.824
+0.28
51.41%
jan 1, 2001
0.867
+0.044
5.31%
jan 1, 2002
2.403
+1.535
177.02%
jan 1, 2003
2.67
+0.267
11.11%
jan 1, 2004
2.368
-0.302
-11.32%
jan 1, 2005
1.722
-0.645
-27.24%
jan 1, 2006
4.847
+3.125
181.42%
jan 1, 2007
6.594
+1.747
36.03%
jan 1, 2008
7.609
+1.015
15.39%
jan 1, 2009
5.809
-1.8
-23.66%
jan 1, 2010
2.361
-3.448
-59.35%
jan 1, 2011
2.304
-0.057
-2.42%
jan 1, 2012
3.957
+1.653
71.75%
jan 1, 2013
3.604
-0.353
-8.91%
jan 1, 2014
4.171
+0.567
15.73%
jan 1, 2015
4.582
+0.411
9.84%
Ranking of countries by current statistics by years


Comments: