29
/
en
AIzaSyAYiBZKx7MnpbEhh9jyipgxe19OcubqV5w
April 1, 2024
225125
Poland
POL
true
2
1
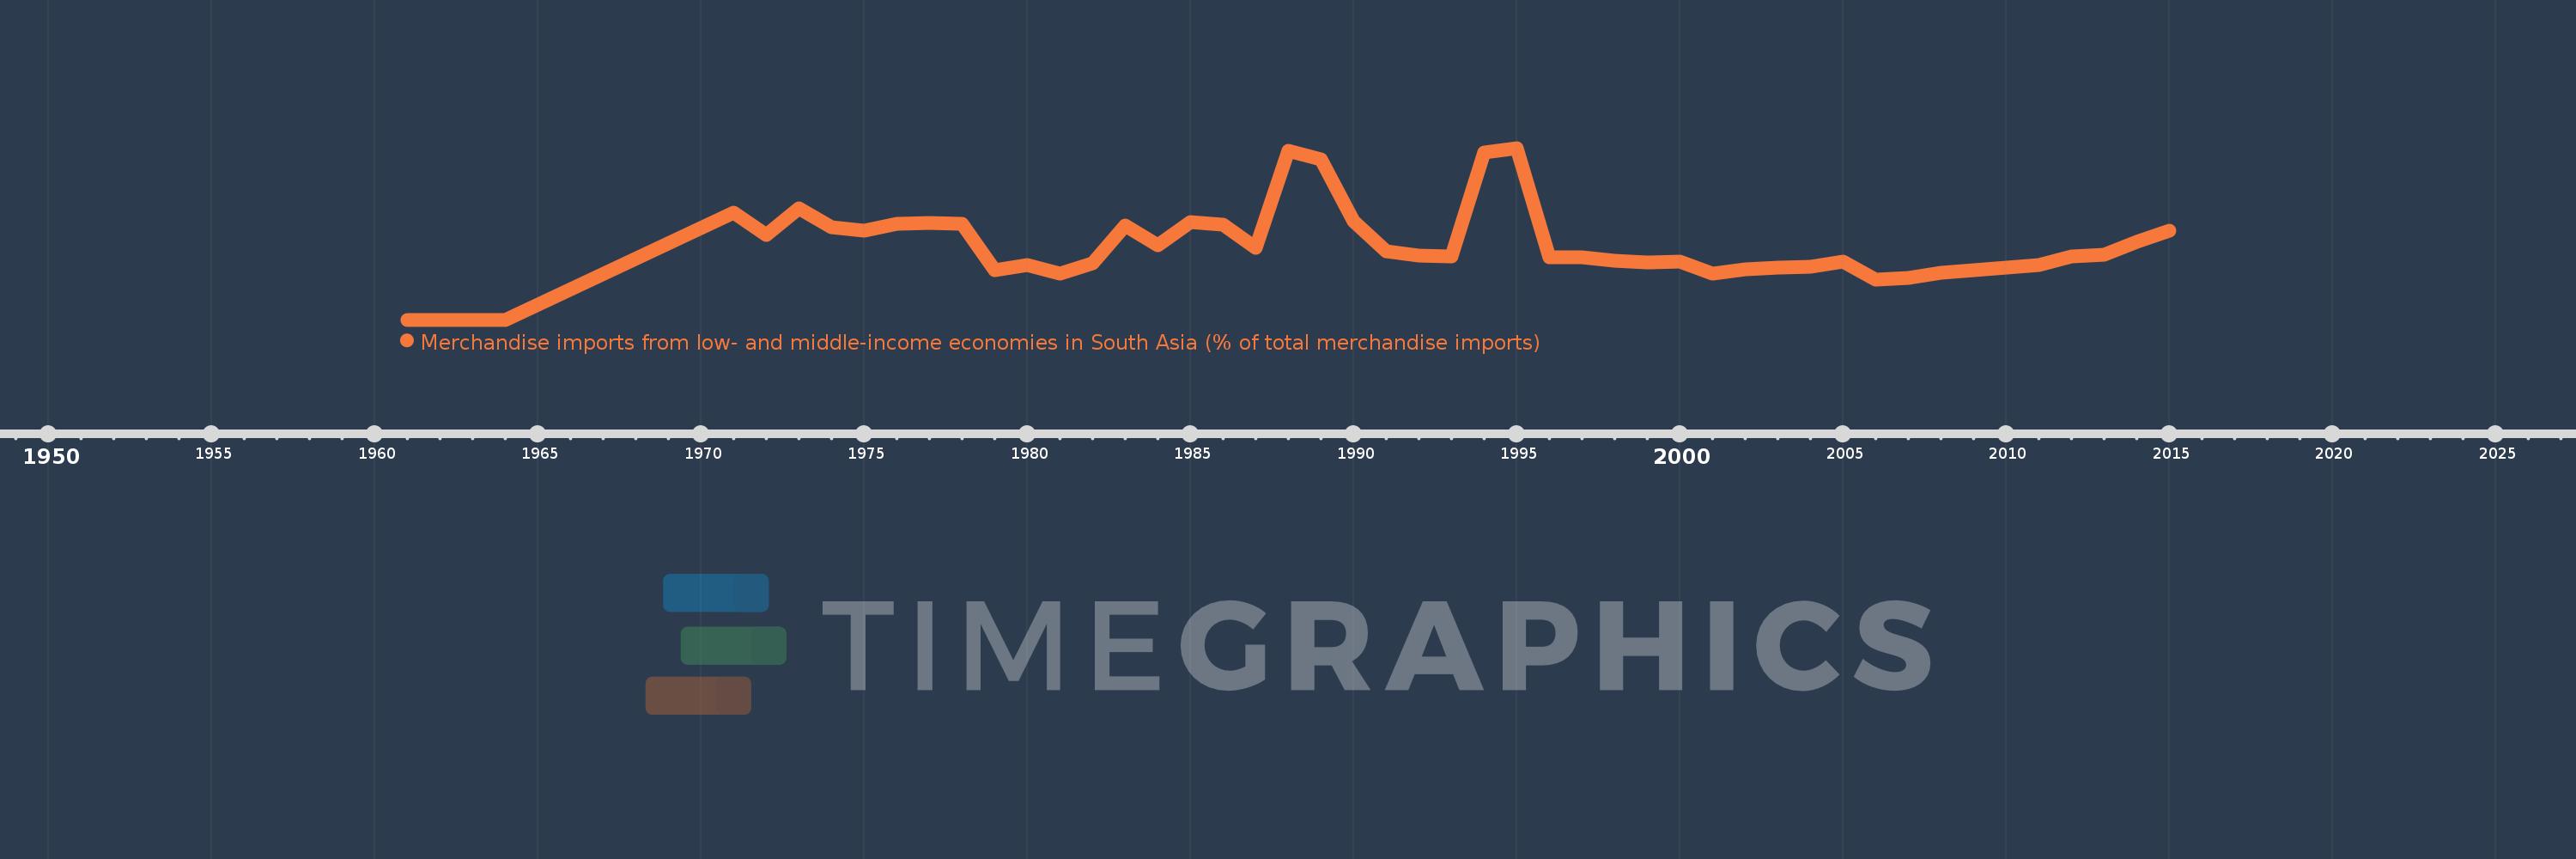
Merchandise imports from low- and middle-income economies in South Asia (% of total merchandise imports)
2015,2014,2013,2012,2011,2010,2009,2008,2007,2006,2005,2004,2003,2002,2001,2000,1999,1998,1997,1996,1995,1994,1993,1992,1991,1990,1989,1988,1987,1986,1985,1984,1983,1982,1981,1980,1979,1978,1977,1976,1975,1974,1973,1972,1971,1964,1963,1962,1961
This statistics in other country:
AfghanistanAlbaniaAlgeriaAngolaAntigua and BarbudaArab WorldArgentinaArmeniaArubaAustraliaAustriaAzerbaijanBahamas, TheBahrainBangladeshBarbadosBelarusBelgiumBelizeBeninBermudaBoliviaBrazilBrunei DarussalamBulgariaBurkina FasoBurundiCabo VerdeCambodiaCameroonCanadaCaribbean small statesCentral African RepublicCentral Europe and the BalticsChadChileChinaColombiaCongo, Dem. Rep.Congo, Rep.Costa RicaCote d'IvoireCroatiaCubaCyprusCzech RepublicDenmarkDjiboutiDominicaDominican RepublicEarly-demographic dividendEast Asia & PacificEast Asia & Pacific (excluding high income)East Asia & Pacific (IDA & IBRD countries)EcuadorEgypt, Arab Rep.El SalvadorEstoniaEthiopiaEuro areaEurope & Central AsiaEurope & Central Asia (excluding high income)Europe & Central Asia (IDA & IBRD countries)European UnionFaroe IslandsFijiFinlandFragile and conflict affected situationsFranceGabonGambia, TheGeorgiaGermanyGhanaGibraltarGreeceGreenlandGrenadaGuatemalaGuineaGuyanaHaitiHeavily indebted poor countries (HIPC)High incomeHondurasHong Kong SAR, ChinaHungaryIBRD onlyIcelandIDA & IBRD totalIDA blendIDA onlyIDA totalIndiaIndonesiaIran, Islamic Rep.IraqIrelandIsraelItalyJamaicaJapanJordanKazakhstanKenyaKiribatiKorea, Dem. People’s Rep.Korea, Rep.KosovoKuwaitKyrgyz RepublicLao PDRLate-demographic dividendLatin America & Caribbean Latin America & Caribbean (excluding high income)Latin America & the Caribbean (IDA & IBRD countries)LatviaLeast developed countries: UN classificationLebanonLiberiaLibyaLithuaniaLow & middle incomeLow incomeLower middle incomeLuxembourgMacao SAR, ChinaMacedonia, FYRMadagascarMalawiMalaysiaMaldivesMaliMaltaMauritaniaMauritiusMexicoMiddle East & North AfricaMiddle East & North Africa (excluding high income)Middle East & North Africa (IDA & IBRD countries)Middle incomeMoldovaMongoliaMontenegroMoroccoMozambiqueMyanmarNauruNepalNetherlandsNew CaledoniaNew ZealandNicaraguaNigerNigeriaNorth AmericaNorwayOECD membersOmanOther small statesPacific island small statesPakistanPanamaPapua New GuineaParaguayPeruPhilippinesPolandPortugalPost-demographic dividendPre-demographic dividendQatarRomaniaRussian FederationRwandaSamoaSaudi ArabiaSenegalSerbiaSeychellesSierra LeoneSingaporeSlovak RepublicSloveniaSmall statesSolomon IslandsSomaliaSouth AfricaSouth AsiaSouth Asia (IDA & IBRD)SpainSri LankaSt. Kitts and NevisSt. LuciaSt. Vincent and the GrenadinesSub-Saharan Africa Sub-Saharan Africa (excluding high income)Sub-Saharan Africa (IDA & IBRD countries)SudanSurinameSwedenSwitzerlandSyrian Arab RepublicTajikistanTanzaniaThailandTogoTongaTrinidad and TobagoTunisiaTurkeyTurkmenistanUgandaUkraineUnited Arab EmiratesUnited KingdomUnited StatesUpper middle incomeUruguayUzbekistanVanuatuVenezuela, RBVietnamWorldYemen, Rep.ZambiaZimbabwe Timeline:
This timeline shows a graph from 1961 to 2015 of Poland. No data until 1960. Number of actual observations by date: 49.
Source name:
World Development Indicators
Source organization:
World Bank staff estimates based data from International Monetary Fund's Direction of Trade database.
Categories, topics:
Private Sector, Trade
Last updated:
apr 23, 2017
Indicators value changes by year
At the date of observation
Value
Absolute change
Change from previous value
jan 1, 1971
0.923
+0.923
%
jan 1, 1972
0.731
-0.192
-20.85%
jan 1, 1973
0.958
+0.228
31.17%
jan 1, 1974
0.799
-0.16
-16.66%
jan 1, 1975
0.765
-0.033
-4.18%
jan 1, 1976
0.828
+0.062
8.15%
jan 1, 1977
0.832
+0.004
0.47%
jan 1, 1978
0.827
-0.005
-0.6%
jan 1, 1979
0.426
-0.401
-48.51%
jan 1, 1980
0.471
+0.046
10.7%
jan 1, 1981
0.399
-0.072
-15.35%
jan 1, 1982
0.489
+0.091
22.71%
jan 1, 1983
0.807
+0.317
64.8%
jan 1, 1984
0.643
-0.164
-20.29%
jan 1, 1985
0.842
+0.199
30.99%
jan 1, 1986
0.815
-0.028
-3.28%
jan 1, 1987
0.616
-0.199
-24.4%
jan 1, 1988
1.45
+0.834
135.49%
jan 1, 1989
1.383
-0.067
-4.61%
jan 1, 1990
0.851
-0.533
-38.51%
jan 1, 1991
0.592
-0.258
-30.35%
jan 1, 1992
0.554
-0.038
-6.48%
jan 1, 1993
0.544
-0.01
-1.79%
jan 1, 1994
1.437
+0.892
164.03%
jan 1, 1995
1.478
+0.042
2.9%
jan 1, 1996
0.538
-0.94
-63.62%
jan 1, 1997
0.538
0.0
-0.06%
jan 1, 1998
0.504
-0.034
-6.3%
jan 1, 1999
0.492
-0.012
-2.35%
jan 1, 2000
0.501
+0.009
1.87%
jan 1, 2001
0.399
-0.102
-20.44%
jan 1, 2002
0.431
+0.032
8.15%
jan 1, 2003
0.452
+0.021
4.94%
jan 1, 2004
0.459
+0.007
1.45%
jan 1, 2005
0.502
+0.044
9.5%
jan 1, 2006
0.342
-0.161
-31.94%
jan 1, 2007
0.359
+0.017
5.1%
jan 1, 2008
0.401
+0.041
11.49%
jan 1, 2009
0.425
+0.024
6.03%
jan 1, 2010
0.447
+0.023
5.32%
jan 1, 2011
0.474
+0.026
5.83%
jan 1, 2012
0.543
+0.07
14.77%
jan 1, 2013
0.562
+0.018
3.35%
jan 1, 2014
0.671
+0.11
19.52%
jan 1, 2015
0.763
+0.092
13.68%
Ranking of countries by current statistics by years


Comments: