29
/
en
AIzaSyAYiBZKx7MnpbEhh9jyipgxe19OcubqV5w
April 1, 2024
103872
Chad
TCD
true
2
1
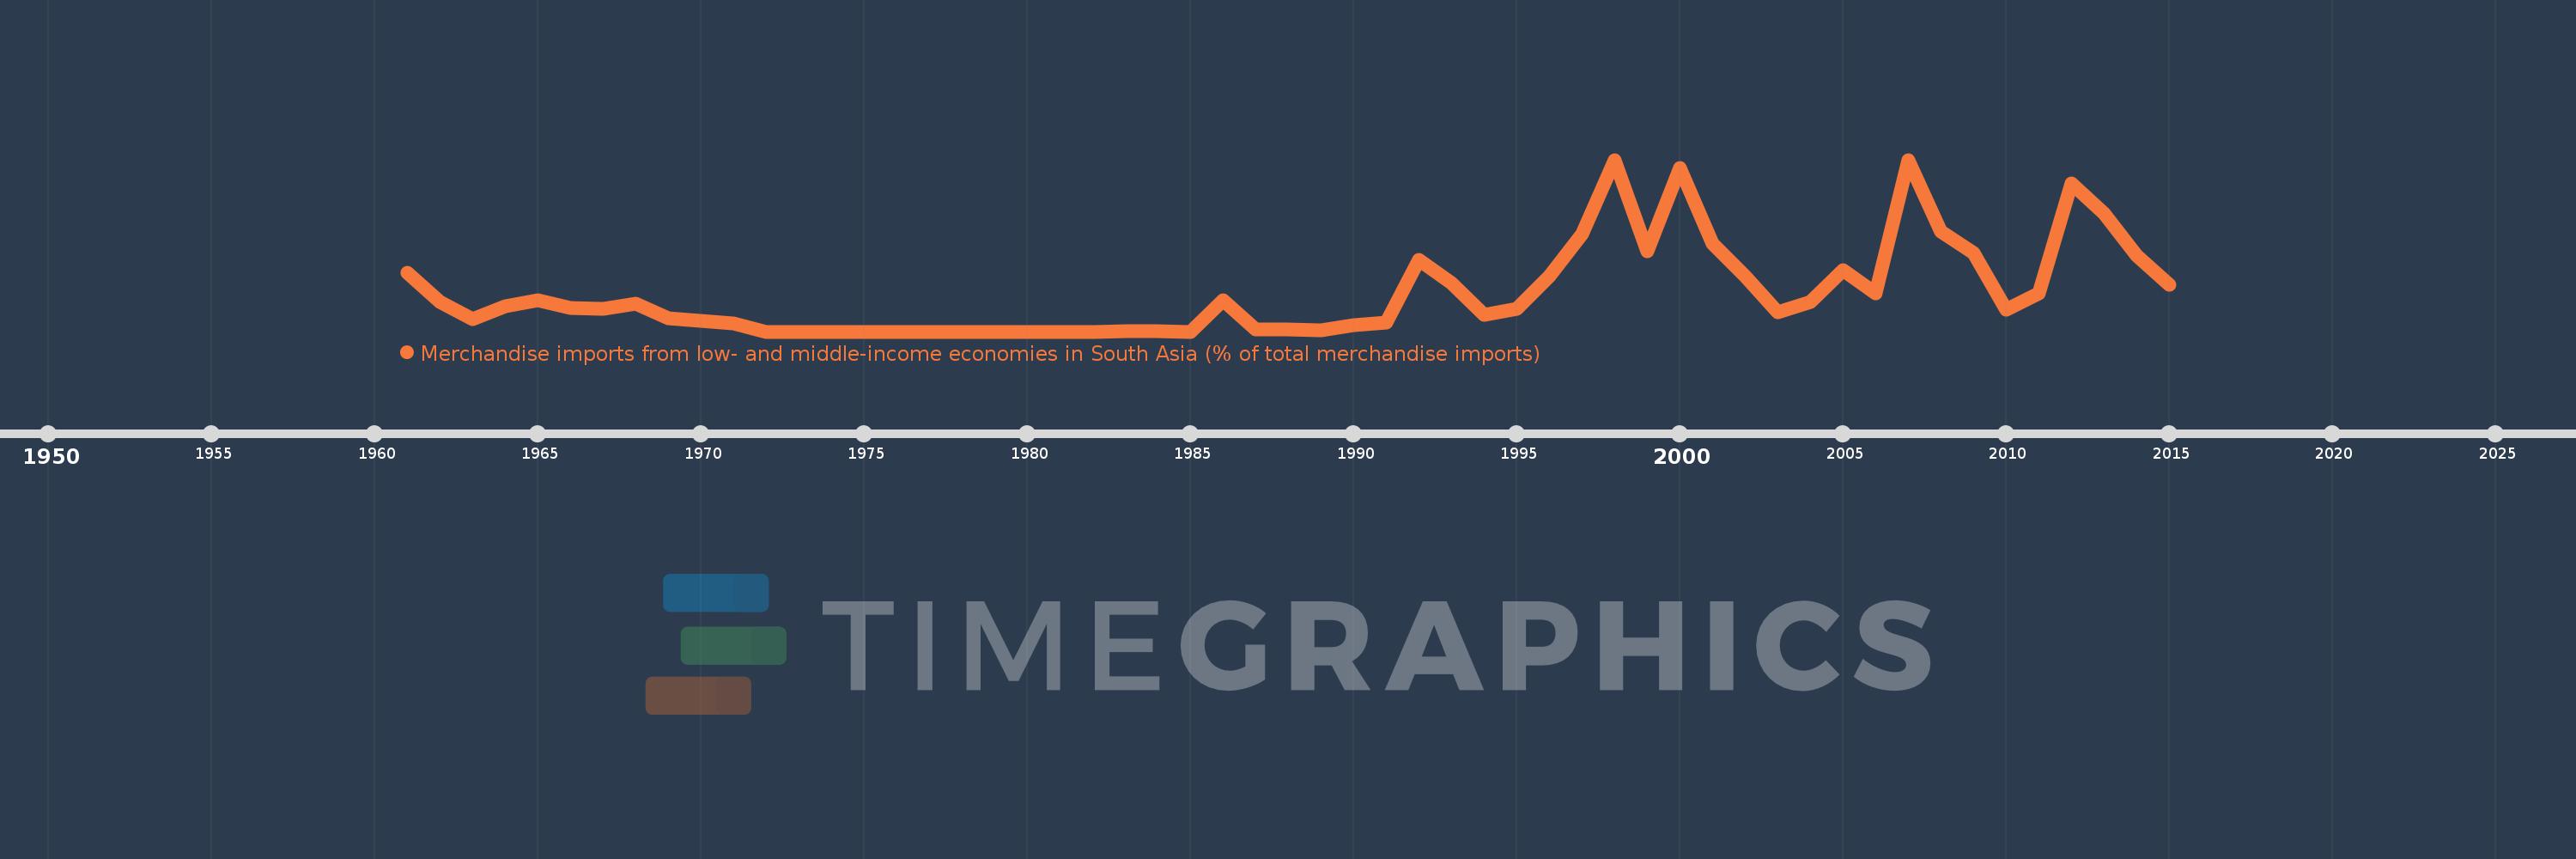
Merchandise imports from low- and middle-income economies in South Asia (% of total merchandise imports)
2015,2014,2013,2012,2011,2010,2009,2008,2007,2006,2005,2004,2003,2002,2001,2000,1999,1998,1997,1996,1995,1994,1993,1992,1991,1990,1989,1988,1987,1986,1985,1984,1983,1982,1976,1975,1974,1973,1972,1971,1970,1969,1968,1967,1966,1965,1964,1963,1962,1961
This statistics in other country:
AfghanistanAlbaniaAlgeriaAngolaAntigua and BarbudaArab WorldArgentinaArmeniaArubaAustraliaAustriaAzerbaijanBahamas, TheBahrainBangladeshBarbadosBelarusBelgiumBelizeBeninBermudaBoliviaBrazilBrunei DarussalamBulgariaBurkina FasoBurundiCabo VerdeCambodiaCameroonCanadaCaribbean small statesCentral African RepublicCentral Europe and the BalticsChadChileChinaColombiaCongo, Dem. Rep.Congo, Rep.Costa RicaCote d'IvoireCroatiaCubaCyprusCzech RepublicDenmarkDjiboutiDominicaDominican RepublicEarly-demographic dividendEast Asia & PacificEast Asia & Pacific (excluding high income)East Asia & Pacific (IDA & IBRD countries)EcuadorEgypt, Arab Rep.El SalvadorEstoniaEthiopiaEuro areaEurope & Central AsiaEurope & Central Asia (excluding high income)Europe & Central Asia (IDA & IBRD countries)European UnionFaroe IslandsFijiFinlandFragile and conflict affected situationsFranceGabonGambia, TheGeorgiaGermanyGhanaGibraltarGreeceGreenlandGrenadaGuatemalaGuineaGuyanaHaitiHeavily indebted poor countries (HIPC)High incomeHondurasHong Kong SAR, ChinaHungaryIBRD onlyIcelandIDA & IBRD totalIDA blendIDA onlyIDA totalIndiaIndonesiaIran, Islamic Rep.IraqIrelandIsraelItalyJamaicaJapanJordanKazakhstanKenyaKiribatiKorea, Dem. People’s Rep.Korea, Rep.KosovoKuwaitKyrgyz RepublicLao PDRLate-demographic dividendLatin America & Caribbean Latin America & Caribbean (excluding high income)Latin America & the Caribbean (IDA & IBRD countries)LatviaLeast developed countries: UN classificationLebanonLiberiaLibyaLithuaniaLow & middle incomeLow incomeLower middle incomeLuxembourgMacao SAR, ChinaMacedonia, FYRMadagascarMalawiMalaysiaMaldivesMaliMaltaMauritaniaMauritiusMexicoMiddle East & North AfricaMiddle East & North Africa (excluding high income)Middle East & North Africa (IDA & IBRD countries)Middle incomeMoldovaMongoliaMontenegroMoroccoMozambiqueMyanmarNauruNepalNetherlandsNew CaledoniaNew ZealandNicaraguaNigerNigeriaNorth AmericaNorwayOECD membersOmanOther small statesPacific island small statesPakistanPanamaPapua New GuineaParaguayPeruPhilippinesPolandPortugalPost-demographic dividendPre-demographic dividendQatarRomaniaRussian FederationRwandaSamoaSaudi ArabiaSenegalSerbiaSeychellesSierra LeoneSingaporeSlovak RepublicSloveniaSmall statesSolomon IslandsSomaliaSouth AfricaSouth AsiaSouth Asia (IDA & IBRD)SpainSri LankaSt. Kitts and NevisSt. LuciaSt. Vincent and the GrenadinesSub-Saharan Africa Sub-Saharan Africa (excluding high income)Sub-Saharan Africa (IDA & IBRD countries)SudanSurinameSwedenSwitzerlandSyrian Arab RepublicTajikistanTanzaniaThailandTogoTongaTrinidad and TobagoTunisiaTurkeyTurkmenistanUgandaUkraineUnited Arab EmiratesUnited KingdomUnited StatesUpper middle incomeUruguayUzbekistanVanuatuVenezuela, RBVietnamWorldYemen, Rep.ZambiaZimbabwe Timeline:
This timeline shows a graph from 1961 to 2015 of Chad. No data until 1960. Number of actual observations by date: 50.
Source name:
World Development Indicators
Source organization:
World Bank staff estimates based data from International Monetary Fund's Direction of Trade database.
Categories, topics:
Private Sector, Trade
Last updated:
apr 23, 2017
Indicators value changes by year
At the date of observation
Value
Absolute change
Change from previous value
jan 1, 1962
0.797
-0.803
-50.2%
jan 1, 1963
0.342
-0.454
-57.02%
jan 1, 1964
0.69
+0.347
101.38%
jan 1, 1965
0.862
+0.172
25.0%
jan 1, 1966
0.647
-0.215
-24.92%
jan 1, 1967
0.629
-0.018
-2.83%
jan 1, 1968
0.752
+0.123
19.55%
jan 1, 1969
0.373
-0.379
-50.37%
jan 1, 1970
0.283
-0.09
-24.23%
jan 1, 1971
0.222
-0.061
-21.63%
jan 1, 1972
0.0
-0.222
-100.0%
jan 1, 1983
0.017
+0.017
%
jan 1, 1984
0.013
-0.004
-24.13%
jan 1, 1985
0.0
-0.013
-100.0%
jan 1, 1986
0.862
+0.862
%
jan 1, 1987
0.052
-0.81
-93.99%
jan 1, 1988
0.069
+0.018
34.19%
jan 1, 1989
0.025
-0.044
-64.05%
jan 1, 1990
0.174
+0.149
596.17%
jan 1, 1991
0.246
+0.072
41.46%
jan 1, 1992
1.952
+1.706
693.8%
jan 1, 1993
1.318
-0.634
-32.47%
jan 1, 1994
0.462
-0.857
-64.98%
jan 1, 1995
0.625
+0.163
35.34%
jan 1, 1996
1.52
+0.895
143.26%
jan 1, 1997
2.663
+1.143
75.21%
jan 1, 1998
4.685
+2.022
75.94%
jan 1, 1999
2.188
-2.497
-53.3%
jan 1, 2000
4.461
+2.273
103.88%
jan 1, 2001
2.39
-2.071
-46.42%
jan 1, 2002
1.516
-0.874
-36.59%
jan 1, 2003
0.526
-0.989
-65.27%
jan 1, 2004
0.815
+0.289
54.82%
jan 1, 2005
1.68
+0.865
106.11%
jan 1, 2006
1.052
-0.628
-37.37%
jan 1, 2007
4.667
+3.615
343.53%
jan 1, 2008
2.73
-1.936
-41.49%
jan 1, 2009
2.135
-0.595
-21.8%
jan 1, 2010
0.605
-1.53
-71.66%
jan 1, 2011
1.034
+0.429
70.89%
jan 1, 2012
4.041
+3.008
290.88%
jan 1, 2013
3.218
-0.823
-20.37%
jan 1, 2014
2.066
-1.152
-35.8%
jan 1, 2015
1.266
-0.8
-38.74%
Ranking of countries by current statistics by years


Comments: