29
/
en
AIzaSyAYiBZKx7MnpbEhh9jyipgxe19OcubqV5w
April 1, 2024
43652
Latin America & the Caribbean (IDA & IBRD countries)
TLA
false
2
1
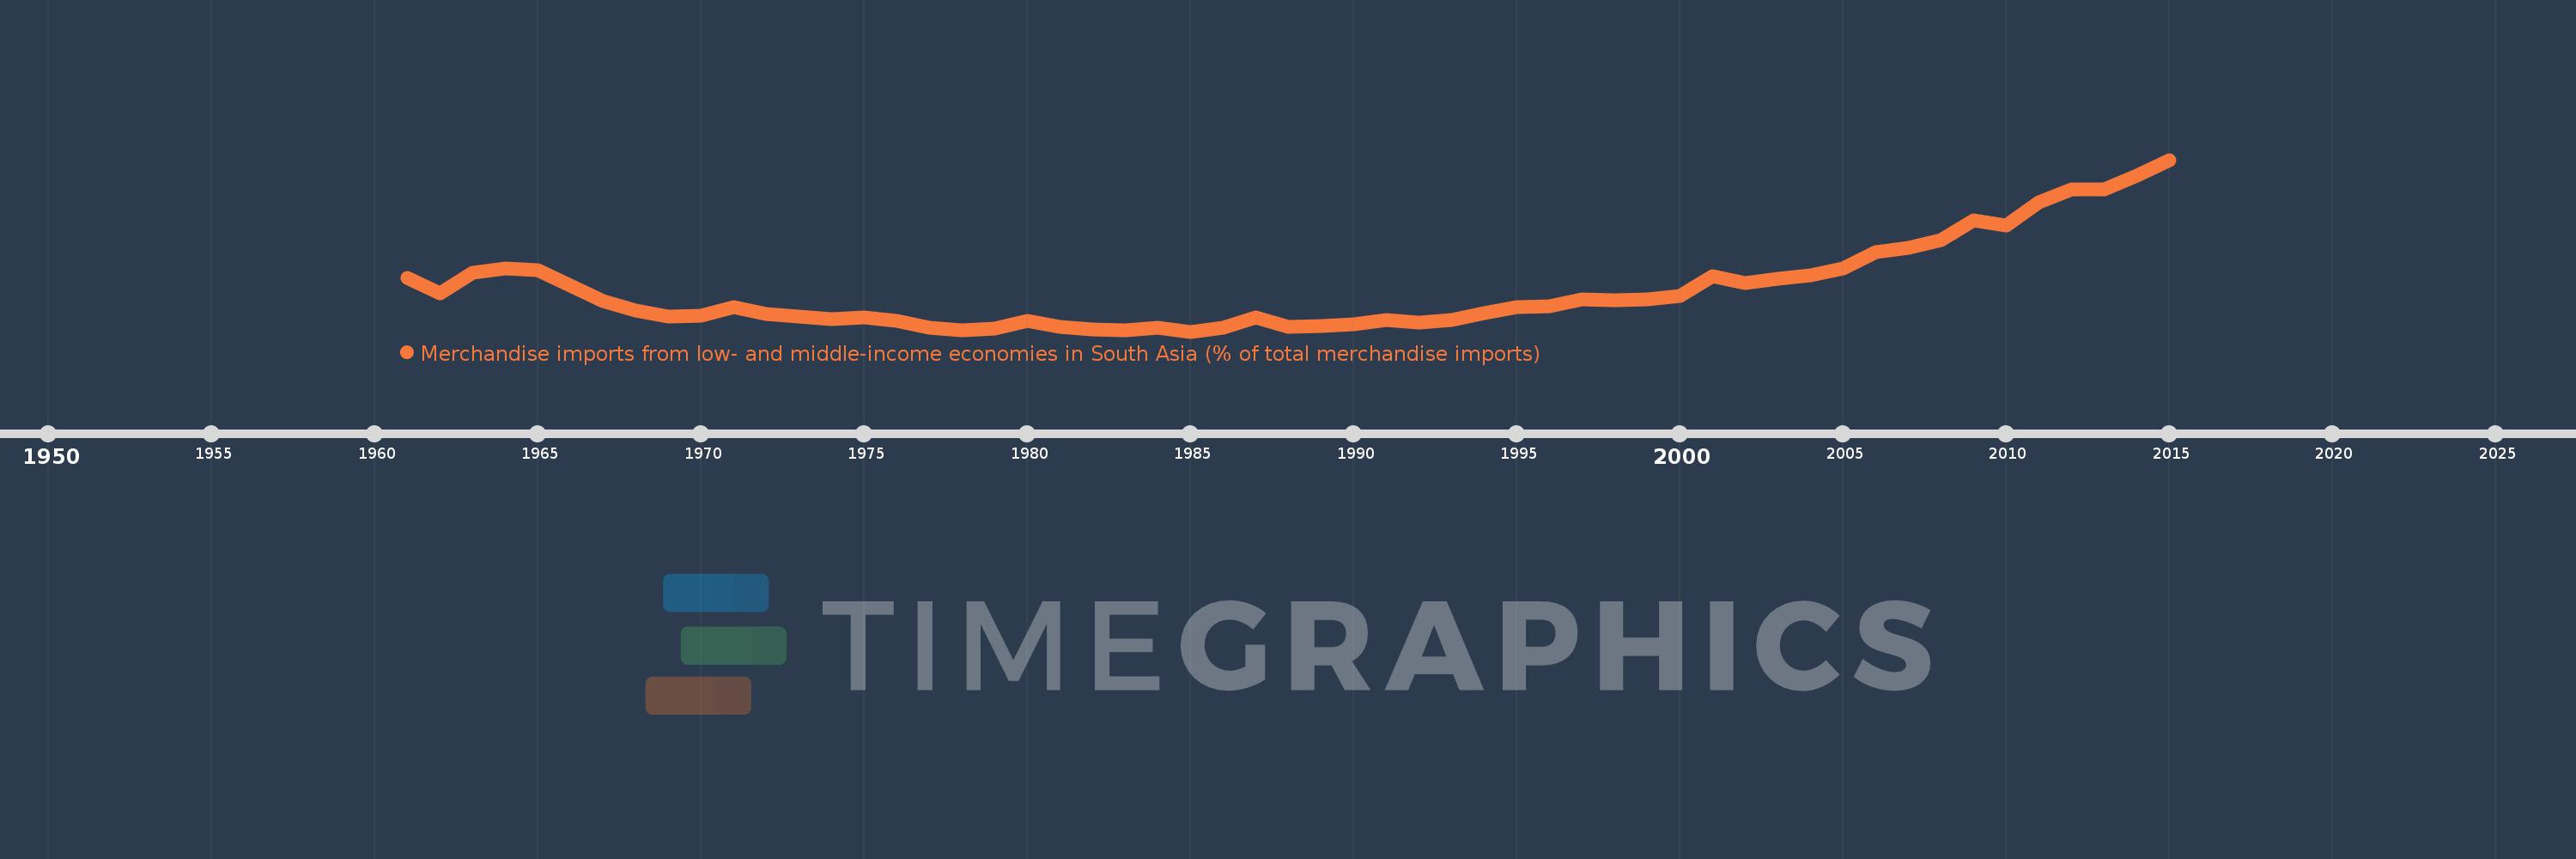
Merchandise imports from low- and middle-income economies in South Asia (% of total merchandise imports)
2015,2014,2013,2012,2011,2010,2009,2008,2007,2006,2005,2004,2003,2002,2001,2000,1999,1998,1997,1996,1995,1994,1993,1992,1991,1990,1989,1988,1987,1986,1985,1984,1983,1982,1981,1980,1979,1978,1977,1976,1975,1974,1973,1972,1971,1970,1969,1968,1967,1966,1965,1964,1963,1962,1961
This statistics in other country:
AfghanistanAlbaniaAlgeriaAngolaAntigua and BarbudaArab WorldArgentinaArmeniaArubaAustraliaAustriaAzerbaijanBahamas, TheBahrainBangladeshBarbadosBelarusBelgiumBelizeBeninBermudaBoliviaBrazilBrunei DarussalamBulgariaBurkina FasoBurundiCabo VerdeCambodiaCameroonCanadaCaribbean small statesCentral African RepublicCentral Europe and the BalticsChadChileChinaColombiaCongo, Dem. Rep.Congo, Rep.Costa RicaCote d'IvoireCroatiaCubaCyprusCzech RepublicDenmarkDjiboutiDominicaDominican RepublicEarly-demographic dividendEast Asia & PacificEast Asia & Pacific (excluding high income)East Asia & Pacific (IDA & IBRD countries)EcuadorEgypt, Arab Rep.El SalvadorEstoniaEthiopiaEuro areaEurope & Central AsiaEurope & Central Asia (excluding high income)Europe & Central Asia (IDA & IBRD countries)European UnionFaroe IslandsFijiFinlandFragile and conflict affected situationsFranceGabonGambia, TheGeorgiaGermanyGhanaGibraltarGreeceGreenlandGrenadaGuatemalaGuineaGuyanaHaitiHeavily indebted poor countries (HIPC)High incomeHondurasHong Kong SAR, ChinaHungaryIBRD onlyIcelandIDA & IBRD totalIDA blendIDA onlyIDA totalIndiaIndonesiaIran, Islamic Rep.IraqIrelandIsraelItalyJamaicaJapanJordanKazakhstanKenyaKiribatiKorea, Dem. People’s Rep.Korea, Rep.KosovoKuwaitKyrgyz RepublicLao PDRLate-demographic dividendLatin America & Caribbean Latin America & Caribbean (excluding high income)Latin America & the Caribbean (IDA & IBRD countries)LatviaLeast developed countries: UN classificationLebanonLiberiaLibyaLithuaniaLow & middle incomeLow incomeLower middle incomeLuxembourgMacao SAR, ChinaMacedonia, FYRMadagascarMalawiMalaysiaMaldivesMaliMaltaMauritaniaMauritiusMexicoMiddle East & North AfricaMiddle East & North Africa (excluding high income)Middle East & North Africa (IDA & IBRD countries)Middle incomeMoldovaMongoliaMontenegroMoroccoMozambiqueMyanmarNauruNepalNetherlandsNew CaledoniaNew ZealandNicaraguaNigerNigeriaNorth AmericaNorwayOECD membersOmanOther small statesPacific island small statesPakistanPanamaPapua New GuineaParaguayPeruPhilippinesPolandPortugalPost-demographic dividendPre-demographic dividendQatarRomaniaRussian FederationRwandaSamoaSaudi ArabiaSenegalSerbiaSeychellesSierra LeoneSingaporeSlovak RepublicSloveniaSmall statesSolomon IslandsSomaliaSouth AfricaSouth AsiaSouth Asia (IDA & IBRD)SpainSri LankaSt. Kitts and NevisSt. LuciaSt. Vincent and the GrenadinesSub-Saharan Africa Sub-Saharan Africa (excluding high income)Sub-Saharan Africa (IDA & IBRD countries)SudanSurinameSwedenSwitzerlandSyrian Arab RepublicTajikistanTanzaniaThailandTogoTongaTrinidad and TobagoTunisiaTurkeyTurkmenistanUgandaUkraineUnited Arab EmiratesUnited KingdomUnited StatesUpper middle incomeUruguayUzbekistanVanuatuVenezuela, RBVietnamWorldYemen, Rep.ZambiaZimbabwe Timeline:
This timeline shows a graph from 1961 to 2015 of Latin America & the Caribbean (IDA & IBRD countries). No data until 1960. Number of actual observations by date: 55.
Source name:
World Development Indicators
Source organization:
World Bank staff estimates based data from International Monetary Fund's Direction of Trade database.
Categories, topics:
Private Sector, Trade
Last updated:
apr 23, 2017
Indicators value changes by year
At the date of observation
Value
Absolute change
Change from previous value
jan 1, 1961
0.538
+0.538
0.0%
jan 1, 1962
0.401
-0.136
-25.36%
jan 1, 1963
0.581
+0.18
44.82%
jan 1, 1964
0.623
+0.042
7.15%
jan 1, 1965
0.603
-0.019
-3.1%
jan 1, 1966
0.465
-0.138
-22.87%
jan 1, 1967
0.33
-0.135
-29.05%
jan 1, 1968
0.249
-0.081
-24.67%
jan 1, 1969
0.194
-0.055
-22.13%
jan 1, 1970
0.199
+0.005
2.79%
jan 1, 1971
0.279
+0.08
40.33%
jan 1, 1972
0.215
-0.064
-23.06%
jan 1, 1973
0.193
-0.022
-10.43%
jan 1, 1974
0.166
-0.026
-13.6%
jan 1, 1975
0.182
+0.016
9.58%
jan 1, 1976
0.157
-0.025
-13.62%
jan 1, 1977
0.095
-0.063
-39.84%
jan 1, 1978
0.069
-0.025
-26.88%
jan 1, 1979
0.082
+0.013
18.36%
jan 1, 1980
0.153
+0.071
86.38%
jan 1, 1981
0.102
-0.051
-33.31%
jan 1, 1982
0.076
-0.026
-25.84%
jan 1, 1983
0.073
-0.002
-2.97%
jan 1, 1984
0.09
+0.016
22.25%
jan 1, 1985
0.059
-0.03
-33.75%
jan 1, 1986
0.092
+0.032
54.54%
jan 1, 1987
0.183
+0.091
99.14%
jan 1, 1988
0.104
-0.079
-42.99%
jan 1, 1989
0.111
+0.007
6.26%
jan 1, 1990
0.126
+0.016
14.17%
jan 1, 1991
0.16
+0.034
26.57%
jan 1, 1992
0.137
-0.023
-14.4%
jan 1, 1993
0.159
+0.022
16.29%
jan 1, 1994
0.227
+0.068
42.58%
jan 1, 1995
0.276
+0.049
21.36%
jan 1, 1996
0.288
+0.012
4.41%
jan 1, 1997
0.342
+0.055
19.01%
jan 1, 1998
0.336
-0.007
-2.02%
jan 1, 1999
0.345
+0.009
2.72%
jan 1, 2000
0.377
+0.033
9.52%
jan 1, 2001
0.55
+0.172
45.58%
jan 1, 2002
0.487
-0.062
-11.34%
jan 1, 2003
0.532
+0.045
9.28%
jan 1, 2004
0.556
+0.024
4.42%
jan 1, 2005
0.62
+0.064
11.54%
jan 1, 2006
0.768
+0.148
23.79%
jan 1, 2007
0.803
+0.035
4.56%
jan 1, 2008
0.87
+0.068
8.43%
jan 1, 2009
1.048
+0.178
20.4%
jan 1, 2010
1.005
-0.043
-4.1%
jan 1, 2011
1.206
+0.201
20.02%
jan 1, 2012
1.324
+0.119
9.83%
jan 1, 2013
1.327
+0.003
0.21%
jan 1, 2014
1.448
+0.121
9.12%
jan 1, 2015
1.587
+0.139
9.61%
Ranking of countries by current statistics by years


Comments: