29
/
en
AIzaSyAYiBZKx7MnpbEhh9jyipgxe19OcubqV5w
April 1, 2024
275948
United Kingdom
GBR
true
2
1
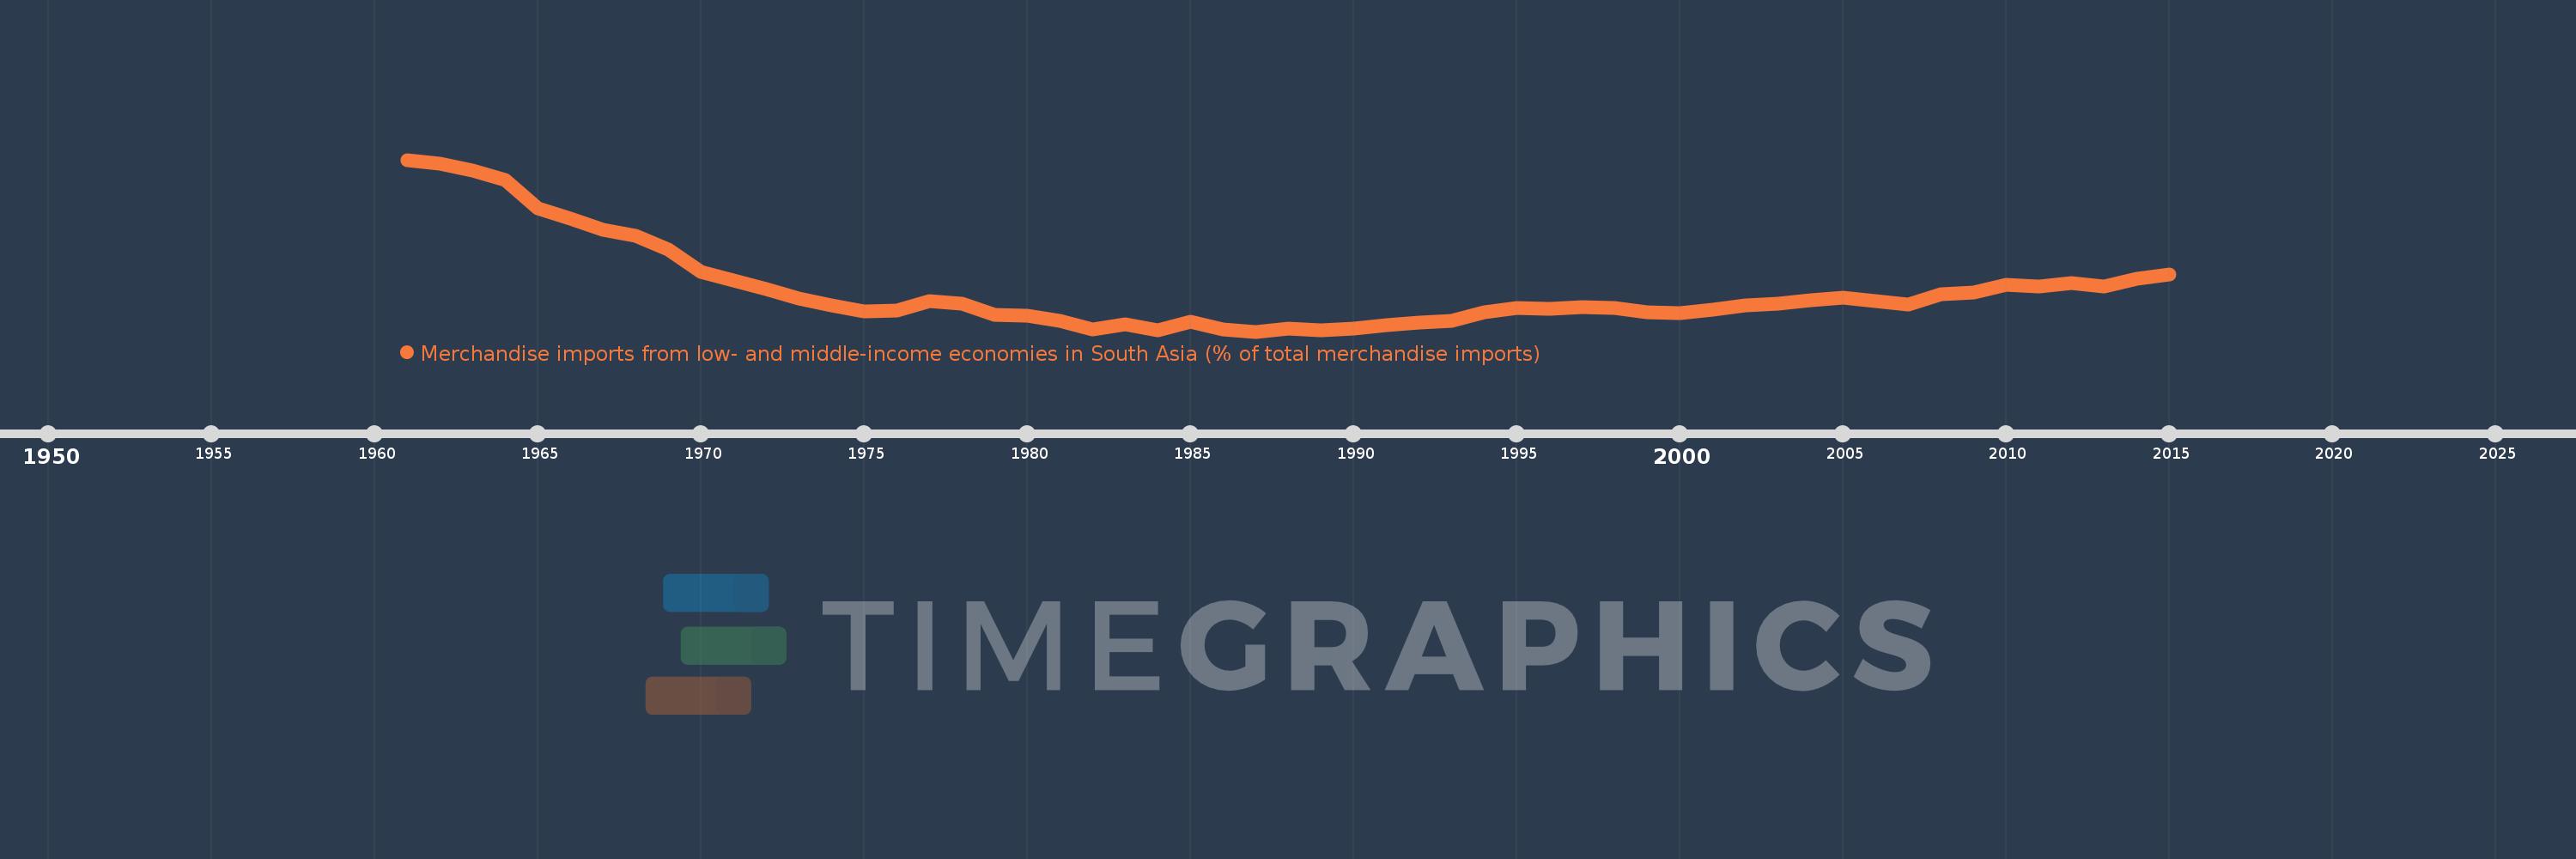
Merchandise imports from low- and middle-income economies in South Asia (% of total merchandise imports)
2015,2014,2013,2012,2011,2010,2009,2008,2007,2006,2005,2004,2003,2002,2001,2000,1999,1998,1997,1996,1995,1994,1993,1992,1991,1990,1989,1988,1987,1986,1985,1984,1983,1982,1981,1980,1979,1978,1977,1976,1975,1974,1973,1972,1971,1970,1969,1968,1967,1966,1965,1964,1963,1962,1961
This statistics in other country:
AfghanistanAlbaniaAlgeriaAngolaAntigua and BarbudaArab WorldArgentinaArmeniaArubaAustraliaAustriaAzerbaijanBahamas, TheBahrainBangladeshBarbadosBelarusBelgiumBelizeBeninBermudaBoliviaBrazilBrunei DarussalamBulgariaBurkina FasoBurundiCabo VerdeCambodiaCameroonCanadaCaribbean small statesCentral African RepublicCentral Europe and the BalticsChadChileChinaColombiaCongo, Dem. Rep.Congo, Rep.Costa RicaCote d'IvoireCroatiaCubaCyprusCzech RepublicDenmarkDjiboutiDominicaDominican RepublicEarly-demographic dividendEast Asia & PacificEast Asia & Pacific (excluding high income)East Asia & Pacific (IDA & IBRD countries)EcuadorEgypt, Arab Rep.El SalvadorEstoniaEthiopiaEuro areaEurope & Central AsiaEurope & Central Asia (excluding high income)Europe & Central Asia (IDA & IBRD countries)European UnionFaroe IslandsFijiFinlandFragile and conflict affected situationsFranceGabonGambia, TheGeorgiaGermanyGhanaGibraltarGreeceGreenlandGrenadaGuatemalaGuineaGuyanaHaitiHeavily indebted poor countries (HIPC)High incomeHondurasHong Kong SAR, ChinaHungaryIBRD onlyIcelandIDA & IBRD totalIDA blendIDA onlyIDA totalIndiaIndonesiaIran, Islamic Rep.IraqIrelandIsraelItalyJamaicaJapanJordanKazakhstanKenyaKiribatiKorea, Dem. People’s Rep.Korea, Rep.KosovoKuwaitKyrgyz RepublicLao PDRLate-demographic dividendLatin America & Caribbean Latin America & Caribbean (excluding high income)Latin America & the Caribbean (IDA & IBRD countries)LatviaLeast developed countries: UN classificationLebanonLiberiaLibyaLithuaniaLow & middle incomeLow incomeLower middle incomeLuxembourgMacao SAR, ChinaMacedonia, FYRMadagascarMalawiMalaysiaMaldivesMaliMaltaMauritaniaMauritiusMexicoMiddle East & North AfricaMiddle East & North Africa (excluding high income)Middle East & North Africa (IDA & IBRD countries)Middle incomeMoldovaMongoliaMontenegroMoroccoMozambiqueMyanmarNauruNepalNetherlandsNew CaledoniaNew ZealandNicaraguaNigerNigeriaNorth AmericaNorwayOECD membersOmanOther small statesPacific island small statesPakistanPanamaPapua New GuineaParaguayPeruPhilippinesPolandPortugalPost-demographic dividendPre-demographic dividendQatarRomaniaRussian FederationRwandaSamoaSaudi ArabiaSenegalSerbiaSeychellesSierra LeoneSingaporeSlovak RepublicSloveniaSmall statesSolomon IslandsSomaliaSouth AfricaSouth AsiaSouth Asia (IDA & IBRD)SpainSri LankaSt. Kitts and NevisSt. LuciaSt. Vincent and the GrenadinesSub-Saharan Africa Sub-Saharan Africa (excluding high income)Sub-Saharan Africa (IDA & IBRD countries)SudanSurinameSwedenSwitzerlandSyrian Arab RepublicTajikistanTanzaniaThailandTogoTongaTrinidad and TobagoTunisiaTurkeyTurkmenistanUgandaUkraineUnited Arab EmiratesUnited KingdomUnited StatesUpper middle incomeUruguayUzbekistanVanuatuVenezuela, RBVietnamWorldYemen, Rep.ZambiaZimbabwe Timeline:
This timeline shows a graph from 1961 to 2015 of United Kingdom. No data until 1960. Number of actual observations by date: 55.
Source name:
World Development Indicators
Source organization:
World Bank staff estimates based data from International Monetary Fund's Direction of Trade database.
Categories, topics:
Private Sector, Trade
Last updated:
apr 23, 2017
Indicators value changes by year
At the date of observation
Value
Absolute change
Change from previous value
jan 1, 1961
5.001
+5.001
0.0%
jan 1, 1962
4.902
-0.099
-1.97%
jan 1, 1963
4.742
-0.16
-3.26%
jan 1, 1964
4.507
-0.235
-4.96%
jan 1, 1965
3.802
-0.705
-15.64%
jan 1, 1966
3.555
-0.248
-6.51%
jan 1, 1967
3.279
-0.276
-7.75%
jan 1, 1968
3.13
-0.149
-4.54%
jan 1, 1969
2.808
-0.322
-10.3%
jan 1, 1970
2.258
-0.549
-19.56%
jan 1, 1971
2.046
-0.213
-9.41%
jan 1, 1972
1.833
-0.213
-10.41%
jan 1, 1973
1.595
-0.238
-12.99%
jan 1, 1974
1.439
-0.156
-9.76%
jan 1, 1975
1.288
-0.151
-10.49%
jan 1, 1976
1.306
+0.018
1.42%
jan 1, 1977
1.528
+0.222
16.98%
jan 1, 1978
1.473
-0.056
-3.63%
jan 1, 1979
1.206
-0.267
-18.15%
jan 1, 1980
1.189
-0.016
-1.36%
jan 1, 1981
1.051
-0.138
-11.64%
jan 1, 1982
0.847
-0.203
-19.37%
jan 1, 1983
0.973
+0.126
14.89%
jan 1, 1984
0.815
-0.159
-16.32%
jan 1, 1985
1.04
+0.226
27.69%
jan 1, 1986
0.847
-0.193
-18.54%
jan 1, 1987
0.789
-0.059
-6.91%
jan 1, 1988
0.866
+0.077
9.76%
jan 1, 1989
0.818
-0.048
-5.52%
jan 1, 1990
0.857
+0.04
4.84%
jan 1, 1991
0.956
+0.099
11.54%
jan 1, 1992
1.02
+0.063
6.64%
jan 1, 1993
1.061
+0.041
4.06%
jan 1, 1994
1.255
+0.193
18.21%
jan 1, 1995
1.362
+0.107
8.51%
jan 1, 1996
1.354
-0.008
-0.59%
jan 1, 1997
1.394
+0.04
2.99%
jan 1, 1998
1.371
-0.023
-1.68%
jan 1, 1999
1.273
-0.098
-7.15%
jan 1, 2000
1.239
-0.034
-2.64%
jan 1, 2001
1.321
+0.083
6.66%
jan 1, 2002
1.426
+0.105
7.92%
jan 1, 2003
1.469
+0.043
3.04%
jan 1, 2004
1.567
+0.098
6.67%
jan 1, 2005
1.629
+0.062
3.95%
jan 1, 2006
1.527
-0.102
-6.26%
jan 1, 2007
1.46
-0.067
-4.39%
jan 1, 2008
1.706
+0.246
16.82%
jan 1, 2009
1.752
+0.046
2.7%
jan 1, 2010
1.936
+0.184
10.5%
jan 1, 2011
1.885
-0.05
-2.6%
jan 1, 2012
1.97
+0.084
4.48%
jan 1, 2013
1.888
-0.082
-4.18%
jan 1, 2014
2.08
+0.193
10.21%
jan 1, 2015
2.197
+0.117
5.64%
Ranking of countries by current statistics by years


Comments: