29
/
en
AIzaSyAYiBZKx7MnpbEhh9jyipgxe19OcubqV5w
April 1, 2024
272546
Uganda
UGA
true
2
1
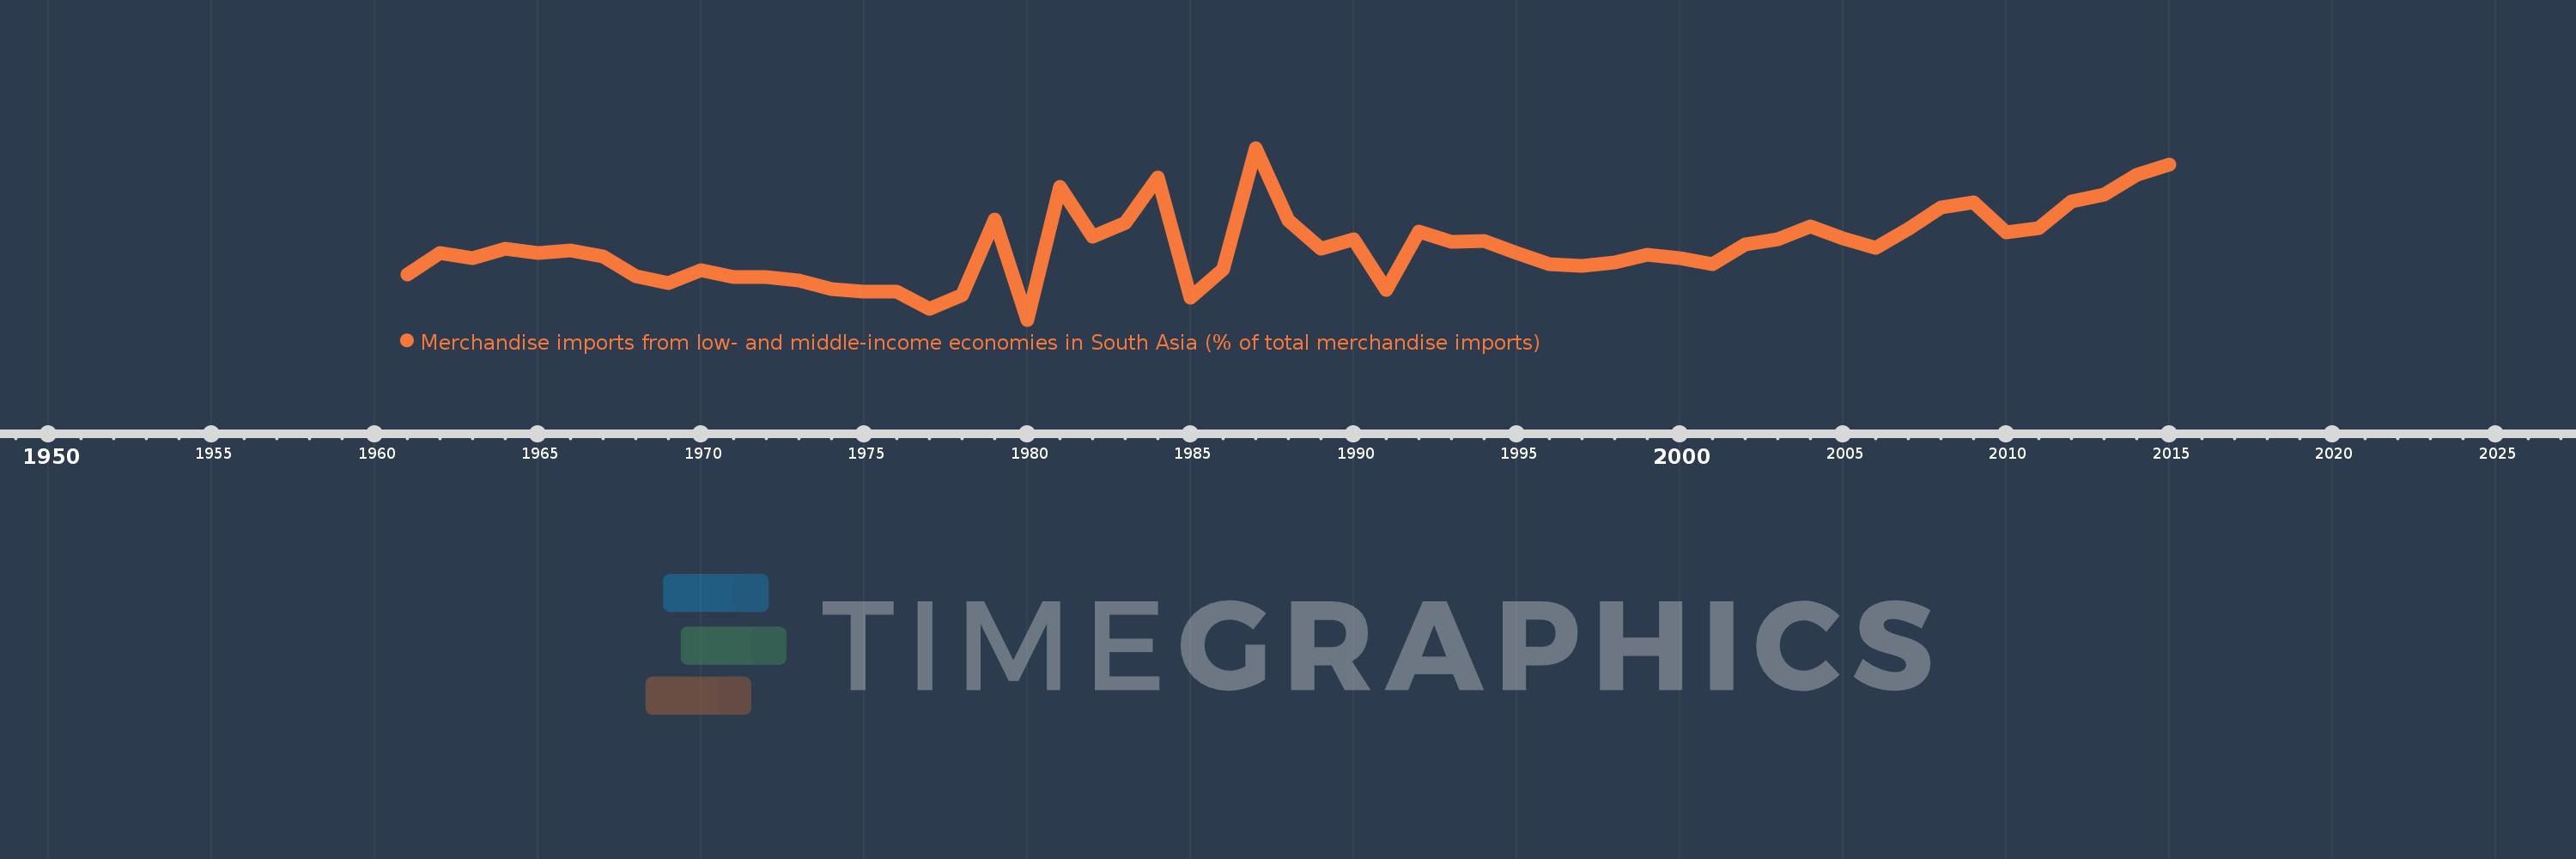
Merchandise imports from low- and middle-income economies in South Asia (% of total merchandise imports)
2015,2014,2013,2012,2011,2010,2009,2008,2007,2006,2005,2004,2003,2002,2001,2000,1999,1998,1997,1996,1995,1994,1993,1992,1991,1990,1989,1988,1987,1986,1985,1984,1983,1982,1981,1980,1979,1978,1977,1976,1975,1974,1973,1972,1971,1970,1969,1968,1967,1966,1965,1964,1963,1962,1961
This statistics in other country:
AfghanistanAlbaniaAlgeriaAngolaAntigua and BarbudaArab WorldArgentinaArmeniaArubaAustraliaAustriaAzerbaijanBahamas, TheBahrainBangladeshBarbadosBelarusBelgiumBelizeBeninBermudaBoliviaBrazilBrunei DarussalamBulgariaBurkina FasoBurundiCabo VerdeCambodiaCameroonCanadaCaribbean small statesCentral African RepublicCentral Europe and the BalticsChadChileChinaColombiaCongo, Dem. Rep.Congo, Rep.Costa RicaCote d'IvoireCroatiaCubaCyprusCzech RepublicDenmarkDjiboutiDominicaDominican RepublicEarly-demographic dividendEast Asia & PacificEast Asia & Pacific (excluding high income)East Asia & Pacific (IDA & IBRD countries)EcuadorEgypt, Arab Rep.El SalvadorEstoniaEthiopiaEuro areaEurope & Central AsiaEurope & Central Asia (excluding high income)Europe & Central Asia (IDA & IBRD countries)European UnionFaroe IslandsFijiFinlandFragile and conflict affected situationsFranceGabonGambia, TheGeorgiaGermanyGhanaGibraltarGreeceGreenlandGrenadaGuatemalaGuineaGuyanaHaitiHeavily indebted poor countries (HIPC)High incomeHondurasHong Kong SAR, ChinaHungaryIBRD onlyIcelandIDA & IBRD totalIDA blendIDA onlyIDA totalIndiaIndonesiaIran, Islamic Rep.IraqIrelandIsraelItalyJamaicaJapanJordanKazakhstanKenyaKiribatiKorea, Dem. People’s Rep.Korea, Rep.KosovoKuwaitKyrgyz RepublicLao PDRLate-demographic dividendLatin America & Caribbean Latin America & Caribbean (excluding high income)Latin America & the Caribbean (IDA & IBRD countries)LatviaLeast developed countries: UN classificationLebanonLiberiaLibyaLithuaniaLow & middle incomeLow incomeLower middle incomeLuxembourgMacao SAR, ChinaMacedonia, FYRMadagascarMalawiMalaysiaMaldivesMaliMaltaMauritaniaMauritiusMexicoMiddle East & North AfricaMiddle East & North Africa (excluding high income)Middle East & North Africa (IDA & IBRD countries)Middle incomeMoldovaMongoliaMontenegroMoroccoMozambiqueMyanmarNauruNepalNetherlandsNew CaledoniaNew ZealandNicaraguaNigerNigeriaNorth AmericaNorwayOECD membersOmanOther small statesPacific island small statesPakistanPanamaPapua New GuineaParaguayPeruPhilippinesPolandPortugalPost-demographic dividendPre-demographic dividendQatarRomaniaRussian FederationRwandaSamoaSaudi ArabiaSenegalSerbiaSeychellesSierra LeoneSingaporeSlovak RepublicSloveniaSmall statesSolomon IslandsSomaliaSouth AfricaSouth AsiaSouth Asia (IDA & IBRD)SpainSri LankaSt. Kitts and NevisSt. LuciaSt. Vincent and the GrenadinesSub-Saharan Africa Sub-Saharan Africa (excluding high income)Sub-Saharan Africa (IDA & IBRD countries)SudanSurinameSwedenSwitzerlandSyrian Arab RepublicTajikistanTanzaniaThailandTogoTongaTrinidad and TobagoTunisiaTurkeyTurkmenistanUgandaUkraineUnited Arab EmiratesUnited KingdomUnited StatesUpper middle incomeUruguayUzbekistanVanuatuVenezuela, RBVietnamWorldYemen, Rep.ZambiaZimbabwe Timeline:
This timeline shows a graph from 1961 to 2015 of Uganda. No data until 1960. Number of actual observations by date: 55.
Source name:
World Development Indicators
Source organization:
World Bank staff estimates based data from International Monetary Fund's Direction of Trade database.
Categories, topics:
Private Sector, Trade
Last updated:
apr 23, 2017
Indicators value changes by year
Maximum:
15.426
jan 1, 1987
At the date of observation
Value
Absolute change
Change from previous value
jan 1, 1961
4.738
+4.738
0.0%
jan 1, 1962
6.569
+1.831
38.65%
jan 1, 1963
6.154
-0.415
-6.32%
jan 1, 1964
6.903
+0.75
12.18%
jan 1, 1965
6.565
-0.339
-4.91%
jan 1, 1966
6.79
+0.226
3.44%
jan 1, 1967
6.25
-0.54
-7.95%
jan 1, 1968
4.651
-1.599
-25.58%
jan 1, 1969
4.025
-0.626
-13.46%
jan 1, 1970
5.093
+1.068
26.52%
jan 1, 1971
4.522
-0.57
-11.2%
jan 1, 1972
4.511
-0.011
-0.25%
jan 1, 1973
4.263
-0.248
-5.5%
jan 1, 1974
3.549
-0.715
-16.76%
jan 1, 1975
3.304
-0.244
-6.89%
jan 1, 1976
3.328
+0.024
0.71%
jan 1, 1977
1.895
-1.432
-43.04%
jan 1, 1978
3.024
+1.128
59.53%
jan 1, 1979
9.426
+6.402
211.73%
jan 1, 1980
0.945
-8.481
-89.98%
jan 1, 1981
12.161
+11.216
1.19K%
jan 1, 1982
7.954
-4.207
-34.6%
jan 1, 1983
9.119
+1.165
14.65%
jan 1, 1984
12.909
+3.79
41.56%
jan 1, 1985
2.807
-10.102
-78.26%
jan 1, 1986
5.231
+2.424
86.37%
jan 1, 1987
15.426
+10.196
194.92%
jan 1, 1988
9.33
-6.096
-39.52%
jan 1, 1989
6.948
-2.382
-25.53%
jan 1, 1990
7.752
+0.804
11.57%
jan 1, 1991
3.46
-4.291
-55.36%
jan 1, 1992
8.355
+4.895
141.46%
jan 1, 1993
7.49
-0.865
-10.35%
jan 1, 1994
7.582
+0.091
1.22%
jan 1, 1995
6.536
-1.046
-13.8%
jan 1, 1996
5.621
-0.915
-14.0%
jan 1, 1997
5.454
-0.167
-2.96%
jan 1, 1998
5.745
+0.29
5.32%
jan 1, 1999
6.456
+0.711
12.38%
jan 1, 2000
6.134
-0.322
-4.99%
jan 1, 2001
5.65
-0.483
-7.88%
jan 1, 2002
7.305
+1.655
29.29%
jan 1, 2003
7.749
+0.443
6.07%
jan 1, 2004
8.843
+1.094
14.12%
jan 1, 2005
7.819
-1.023
-11.57%
jan 1, 2006
7.009
-0.811
-10.37%
jan 1, 2007
8.598
+1.59
22.68%
jan 1, 2008
10.382
+1.783
20.74%
jan 1, 2009
10.865
+0.484
4.66%
jan 1, 2010
8.284
-2.581
-23.76%
jan 1, 2011
8.645
+0.361
4.35%
jan 1, 2012
10.922
+2.277
26.34%
jan 1, 2013
11.46
+0.538
4.93%
jan 1, 2014
13.159
+1.699
14.82%
jan 1, 2015
14.032
+0.873
6.64%
Ranking of countries by current statistics by years


Comments: