29
/
en
AIzaSyAYiBZKx7MnpbEhh9jyipgxe19OcubqV5w
April 1, 2024
101348
Canada
CAN
true
2
1
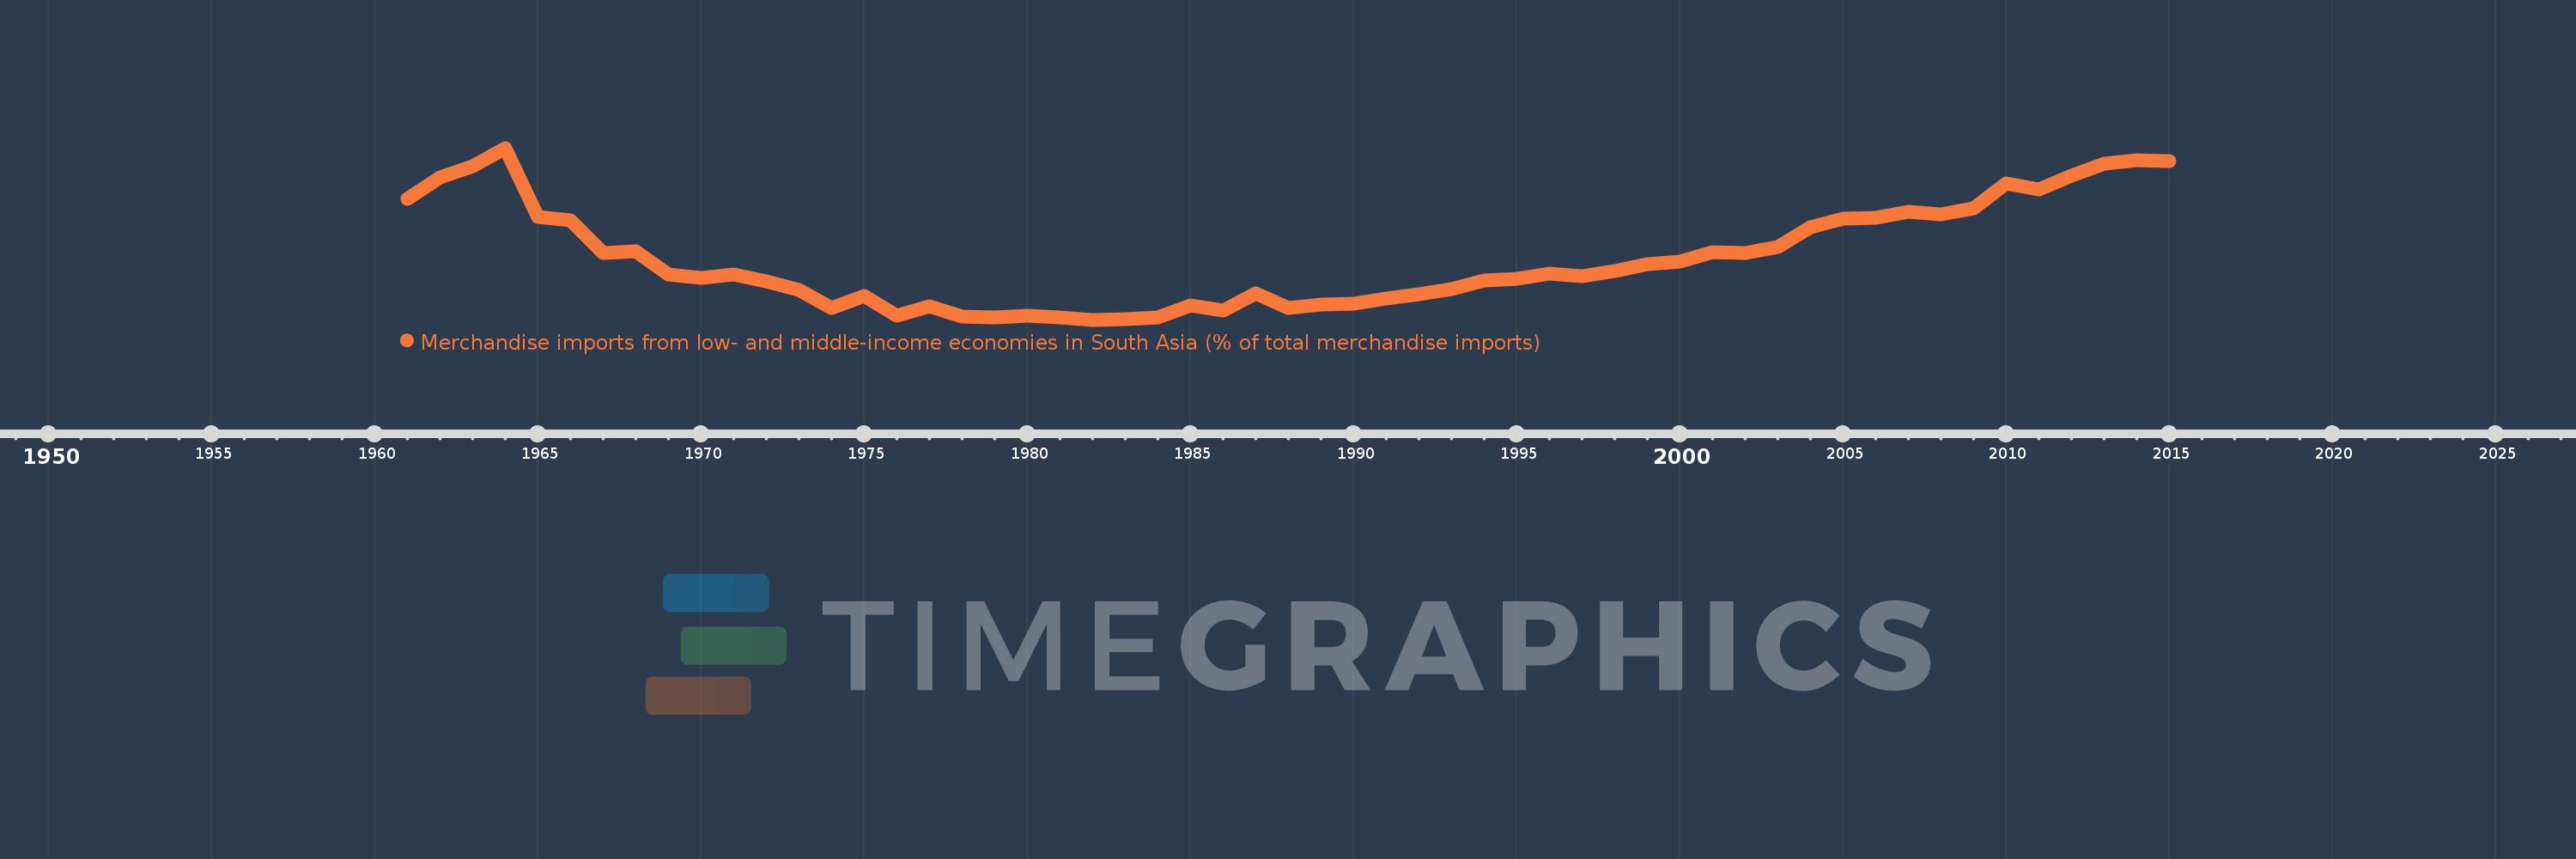
Merchandise imports from low- and middle-income economies in South Asia (% of total merchandise imports)
2015,2014,2013,2012,2011,2010,2009,2008,2007,2006,2005,2004,2003,2002,2001,2000,1999,1998,1997,1996,1995,1994,1993,1992,1991,1990,1989,1988,1987,1986,1985,1984,1983,1982,1981,1980,1979,1978,1977,1976,1975,1974,1973,1972,1971,1970,1969,1968,1967,1966,1965,1964,1963,1962,1961
This statistics in other country:
AfghanistanAlbaniaAlgeriaAngolaAntigua and BarbudaArab WorldArgentinaArmeniaArubaAustraliaAustriaAzerbaijanBahamas, TheBahrainBangladeshBarbadosBelarusBelgiumBelizeBeninBermudaBoliviaBrazilBrunei DarussalamBulgariaBurkina FasoBurundiCabo VerdeCambodiaCameroonCanadaCaribbean small statesCentral African RepublicCentral Europe and the BalticsChadChileChinaColombiaCongo, Dem. Rep.Congo, Rep.Costa RicaCote d'IvoireCroatiaCubaCyprusCzech RepublicDenmarkDjiboutiDominicaDominican RepublicEarly-demographic dividendEast Asia & PacificEast Asia & Pacific (excluding high income)East Asia & Pacific (IDA & IBRD countries)EcuadorEgypt, Arab Rep.El SalvadorEstoniaEthiopiaEuro areaEurope & Central AsiaEurope & Central Asia (excluding high income)Europe & Central Asia (IDA & IBRD countries)European UnionFaroe IslandsFijiFinlandFragile and conflict affected situationsFranceGabonGambia, TheGeorgiaGermanyGhanaGibraltarGreeceGreenlandGrenadaGuatemalaGuineaGuyanaHaitiHeavily indebted poor countries (HIPC)High incomeHondurasHong Kong SAR, ChinaHungaryIBRD onlyIcelandIDA & IBRD totalIDA blendIDA onlyIDA totalIndiaIndonesiaIran, Islamic Rep.IraqIrelandIsraelItalyJamaicaJapanJordanKazakhstanKenyaKiribatiKorea, Dem. People’s Rep.Korea, Rep.KosovoKuwaitKyrgyz RepublicLao PDRLate-demographic dividendLatin America & Caribbean Latin America & Caribbean (excluding high income)Latin America & the Caribbean (IDA & IBRD countries)LatviaLeast developed countries: UN classificationLebanonLiberiaLibyaLithuaniaLow & middle incomeLow incomeLower middle incomeLuxembourgMacao SAR, ChinaMacedonia, FYRMadagascarMalawiMalaysiaMaldivesMaliMaltaMauritaniaMauritiusMexicoMiddle East & North AfricaMiddle East & North Africa (excluding high income)Middle East & North Africa (IDA & IBRD countries)Middle incomeMoldovaMongoliaMontenegroMoroccoMozambiqueMyanmarNauruNepalNetherlandsNew CaledoniaNew ZealandNicaraguaNigerNigeriaNorth AmericaNorwayOECD membersOmanOther small statesPacific island small statesPakistanPanamaPapua New GuineaParaguayPeruPhilippinesPolandPortugalPost-demographic dividendPre-demographic dividendQatarRomaniaRussian FederationRwandaSamoaSaudi ArabiaSenegalSerbiaSeychellesSierra LeoneSingaporeSlovak RepublicSloveniaSmall statesSolomon IslandsSomaliaSouth AfricaSouth AsiaSouth Asia (IDA & IBRD)SpainSri LankaSt. Kitts and NevisSt. LuciaSt. Vincent and the GrenadinesSub-Saharan Africa Sub-Saharan Africa (excluding high income)Sub-Saharan Africa (IDA & IBRD countries)SudanSurinameSwedenSwitzerlandSyrian Arab RepublicTajikistanTanzaniaThailandTogoTongaTrinidad and TobagoTunisiaTurkeyTurkmenistanUgandaUkraineUnited Arab EmiratesUnited KingdomUnited StatesUpper middle incomeUruguayUzbekistanVanuatuVenezuela, RBVietnamWorldYemen, Rep.ZambiaZimbabwe Timeline:
This timeline shows a graph from 1961 to 2015 of Canada. No data until 1960. Number of actual observations by date: 55.
Source name:
World Development Indicators
Source organization:
World Bank staff estimates based data from International Monetary Fund's Direction of Trade database.
Categories, topics:
Private Sector, Trade
Last updated:
apr 23, 2017
Indicators value changes by year
At the date of observation
Value
Absolute change
Change from previous value
jan 1, 1961
0.792
+0.792
0.0%
jan 1, 1962
0.897
+0.105
13.26%
jan 1, 1963
0.956
+0.059
6.59%
jan 1, 1964
1.046
+0.09
9.43%
jan 1, 1965
0.7
-0.346
-33.07%
jan 1, 1966
0.681
-0.019
-2.65%
jan 1, 1967
0.519
-0.163
-23.87%
jan 1, 1968
0.526
+0.008
1.45%
jan 1, 1969
0.41
-0.116
-22.06%
jan 1, 1970
0.391
-0.019
-4.63%
jan 1, 1971
0.41
+0.019
4.73%
jan 1, 1972
0.376
-0.034
-8.19%
jan 1, 1973
0.332
-0.045
-11.86%
jan 1, 1974
0.24
-0.092
-27.65%
jan 1, 1975
0.304
+0.064
26.65%
jan 1, 1976
0.203
-0.101
-33.27%
jan 1, 1977
0.252
+0.05
24.53%
jan 1, 1978
0.197
-0.055
-21.83%
jan 1, 1979
0.195
-0.002
-1.2%
jan 1, 1980
0.202
+0.007
3.69%
jan 1, 1981
0.194
-0.008
-4.03%
jan 1, 1982
0.183
-0.011
-5.52%
jan 1, 1983
0.184
+0.001
0.47%
jan 1, 1984
0.195
+0.011
5.97%
jan 1, 1985
0.254
+0.059
30.12%
jan 1, 1986
0.231
-0.023
-8.99%
jan 1, 1987
0.317
+0.086
37.31%
jan 1, 1988
0.242
-0.076
-23.82%
jan 1, 1989
0.258
+0.016
6.73%
jan 1, 1990
0.262
+0.004
1.43%
jan 1, 1991
0.29
+0.028
10.89%
jan 1, 1992
0.312
+0.022
7.69%
jan 1, 1993
0.336
+0.023
7.41%
jan 1, 1994
0.38
+0.044
13.07%
jan 1, 1995
0.389
+0.009
2.41%
jan 1, 1996
0.414
+0.025
6.52%
jan 1, 1997
0.403
-0.011
-2.72%
jan 1, 1998
0.427
+0.024
5.9%
jan 1, 1999
0.464
+0.037
8.76%
jan 1, 2000
0.474
+0.011
2.27%
jan 1, 2001
0.524
+0.049
10.37%
jan 1, 2002
0.517
-0.007
-1.35%
jan 1, 2003
0.547
+0.03
5.8%
jan 1, 2004
0.648
+0.102
18.6%
jan 1, 2005
0.691
+0.043
6.6%
jan 1, 2006
0.695
+0.004
0.61%
jan 1, 2007
0.724
+0.028
4.08%
jan 1, 2008
0.711
-0.013
-1.78%
jan 1, 2009
0.743
+0.033
4.6%
jan 1, 2010
0.867
+0.124
16.63%
jan 1, 2011
0.837
-0.03
-3.5%
jan 1, 2012
0.905
+0.068
8.13%
jan 1, 2013
0.967
+0.063
6.91%
jan 1, 2014
0.985
+0.018
1.88%
jan 1, 2015
0.978
-0.007
-0.72%
Ranking of countries by current statistics by years


Comments: