29
/
en
AIzaSyAYiBZKx7MnpbEhh9jyipgxe19OcubqV5w
April 1, 2024
179130
Liberia
LBR
true
2
1
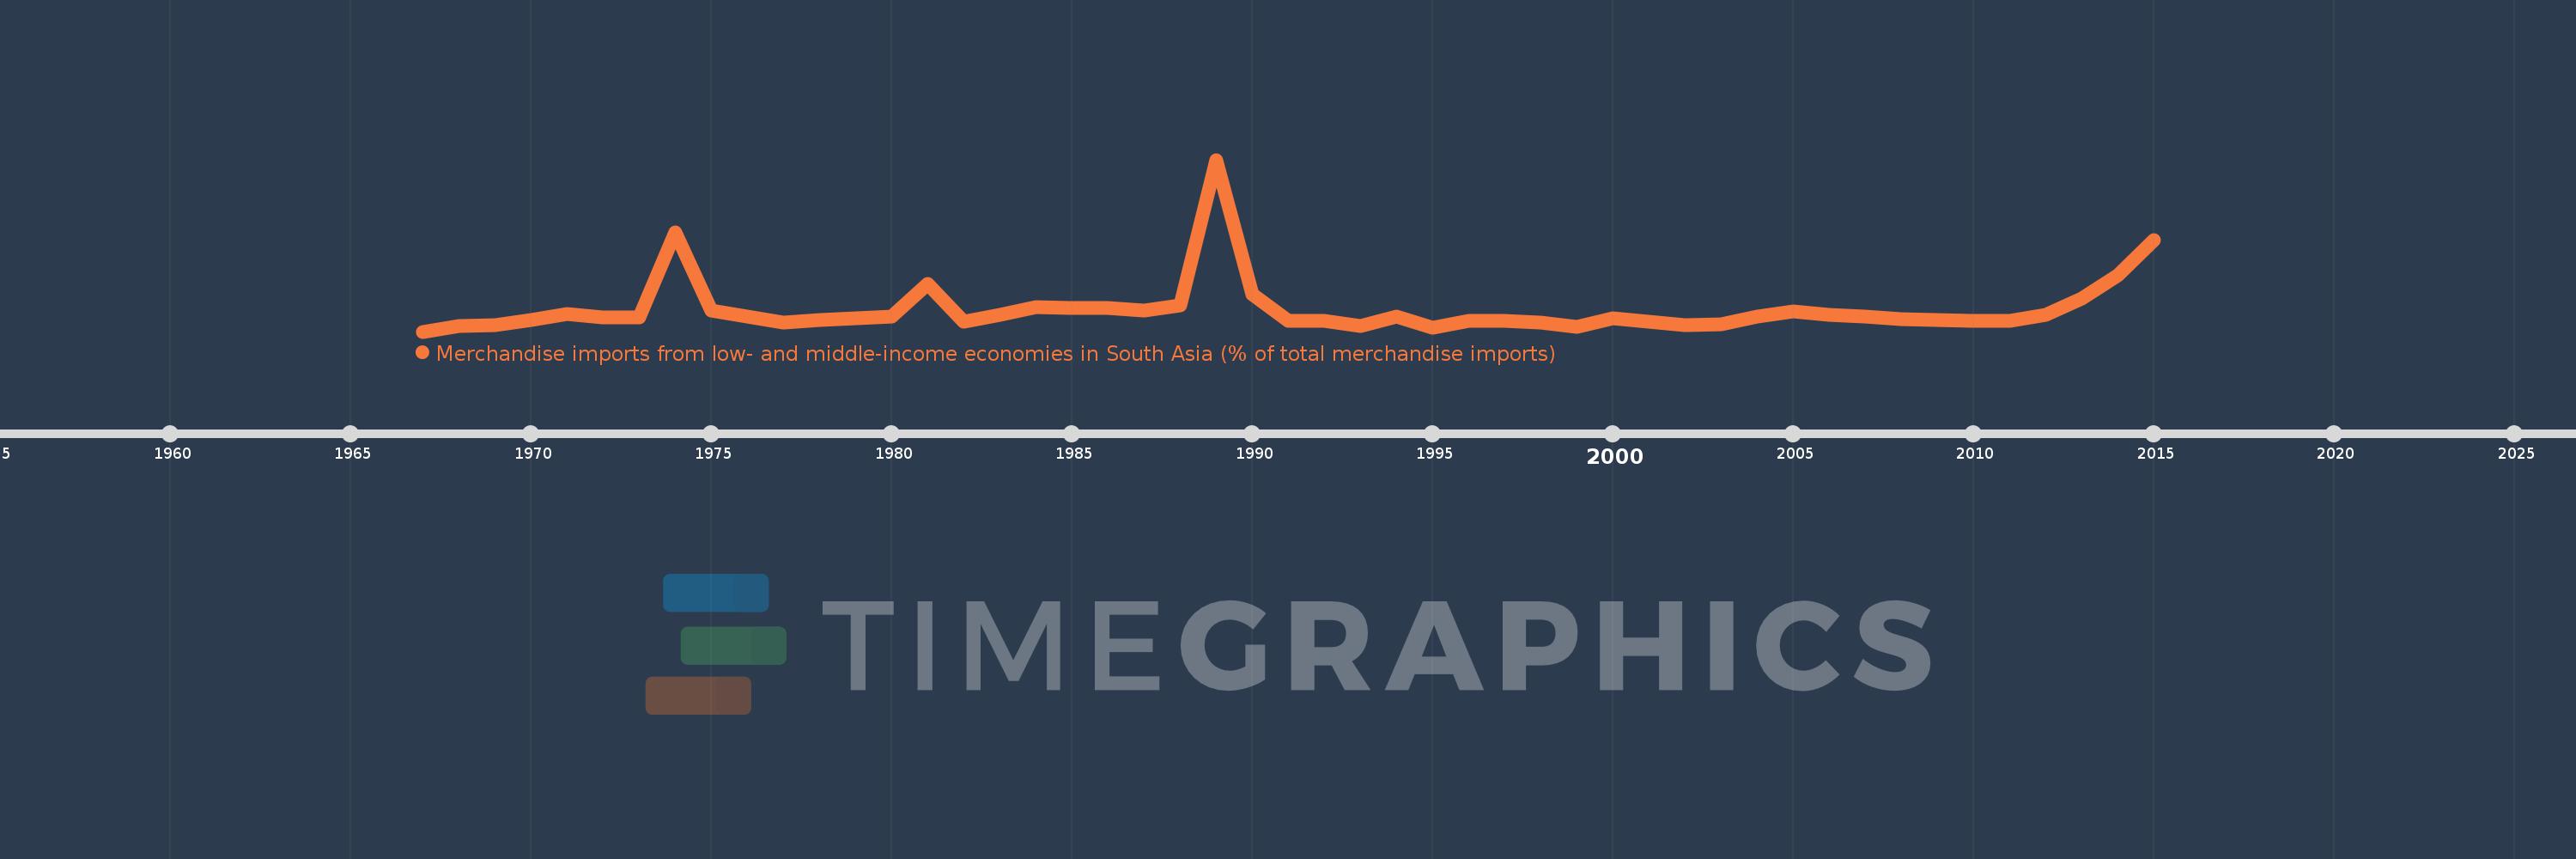
Merchandise imports from low- and middle-income economies in South Asia (% of total merchandise imports)
2015,2014,2013,2012,2011,2010,2009,2008,2007,2006,2005,2004,2003,2002,2001,2000,1999,1998,1997,1996,1995,1994,1993,1992,1991,1990,1989,1988,1987,1986,1985,1984,1983,1982,1981,1980,1979,1978,1977,1976,1975,1974,1973,1972,1971,1970,1969,1968,1967
This statistics in other country:
AfghanistanAlbaniaAlgeriaAngolaAntigua and BarbudaArab WorldArgentinaArmeniaArubaAustraliaAustriaAzerbaijanBahamas, TheBahrainBangladeshBarbadosBelarusBelgiumBelizeBeninBermudaBoliviaBrazilBrunei DarussalamBulgariaBurkina FasoBurundiCabo VerdeCambodiaCameroonCanadaCaribbean small statesCentral African RepublicCentral Europe and the BalticsChadChileChinaColombiaCongo, Dem. Rep.Congo, Rep.Costa RicaCote d'IvoireCroatiaCubaCyprusCzech RepublicDenmarkDjiboutiDominicaDominican RepublicEarly-demographic dividendEast Asia & PacificEast Asia & Pacific (excluding high income)East Asia & Pacific (IDA & IBRD countries)EcuadorEgypt, Arab Rep.El SalvadorEstoniaEthiopiaEuro areaEurope & Central AsiaEurope & Central Asia (excluding high income)Europe & Central Asia (IDA & IBRD countries)European UnionFaroe IslandsFijiFinlandFragile and conflict affected situationsFranceGabonGambia, TheGeorgiaGermanyGhanaGibraltarGreeceGreenlandGrenadaGuatemalaGuineaGuyanaHaitiHeavily indebted poor countries (HIPC)High incomeHondurasHong Kong SAR, ChinaHungaryIBRD onlyIcelandIDA & IBRD totalIDA blendIDA onlyIDA totalIndiaIndonesiaIran, Islamic Rep.IraqIrelandIsraelItalyJamaicaJapanJordanKazakhstanKenyaKiribatiKorea, Dem. People’s Rep.Korea, Rep.KosovoKuwaitKyrgyz RepublicLao PDRLate-demographic dividendLatin America & Caribbean Latin America & Caribbean (excluding high income)Latin America & the Caribbean (IDA & IBRD countries)LatviaLeast developed countries: UN classificationLebanonLiberiaLibyaLithuaniaLow & middle incomeLow incomeLower middle incomeLuxembourgMacao SAR, ChinaMacedonia, FYRMadagascarMalawiMalaysiaMaldivesMaliMaltaMauritaniaMauritiusMexicoMiddle East & North AfricaMiddle East & North Africa (excluding high income)Middle East & North Africa (IDA & IBRD countries)Middle incomeMoldovaMongoliaMontenegroMoroccoMozambiqueMyanmarNauruNepalNetherlandsNew CaledoniaNew ZealandNicaraguaNigerNigeriaNorth AmericaNorwayOECD membersOmanOther small statesPacific island small statesPakistanPanamaPapua New GuineaParaguayPeruPhilippinesPolandPortugalPost-demographic dividendPre-demographic dividendQatarRomaniaRussian FederationRwandaSamoaSaudi ArabiaSenegalSerbiaSeychellesSierra LeoneSingaporeSlovak RepublicSloveniaSmall statesSolomon IslandsSomaliaSouth AfricaSouth AsiaSouth Asia (IDA & IBRD)SpainSri LankaSt. Kitts and NevisSt. LuciaSt. Vincent and the GrenadinesSub-Saharan Africa Sub-Saharan Africa (excluding high income)Sub-Saharan Africa (IDA & IBRD countries)SudanSurinameSwedenSwitzerlandSyrian Arab RepublicTajikistanTanzaniaThailandTogoTongaTrinidad and TobagoTunisiaTurkeyTurkmenistanUgandaUkraineUnited Arab EmiratesUnited KingdomUnited StatesUpper middle incomeUruguayUzbekistanVanuatuVenezuela, RBVietnamWorldYemen, Rep.ZambiaZimbabwe Timeline:
This timeline shows a graph from 1967 to 2015 of Liberia. No data until 1966. Number of actual observations by date: 49.
Source name:
World Development Indicators
Source organization:
World Bank staff estimates based data from International Monetary Fund's Direction of Trade database.
Categories, topics:
Private Sector, Trade
Last updated:
apr 23, 2017
Indicators value changes by year
At the date of observation
Value
Absolute change
Change from previous value
jan 1, 1968
0.138
+0.138
%
jan 1, 1969
0.166
+0.028
20.01%
jan 1, 1970
0.302
+0.136
82.01%
jan 1, 1971
0.445
+0.143
47.43%
jan 1, 1972
0.355
-0.09
-20.29%
jan 1, 1973
0.357
+0.002
0.69%
jan 1, 1974
2.534
+2.177
609.62%
jan 1, 1975
0.536
-1.997
-78.83%
jan 1, 1976
0.374
-0.162
-30.26%
jan 1, 1977
0.219
-0.155
-41.48%
jan 1, 1978
0.303
+0.084
38.24%
jan 1, 1979
0.348
+0.045
14.99%
jan 1, 1980
0.384
+0.036
10.21%
jan 1, 1981
1.206
+0.823
214.47%
jan 1, 1982
0.261
-0.945
-78.32%
jan 1, 1983
0.424
+0.163
62.28%
jan 1, 1984
0.614
+0.189
44.66%
jan 1, 1985
0.604
-0.01
-1.66%
jan 1, 1986
0.604
0.0
0.0%
jan 1, 1987
0.537
-0.067
-11.05%
jan 1, 1988
0.673
+0.136
25.41%
jan 1, 1989
4.375
+3.702
549.85%
jan 1, 1990
0.955
-3.421
-78.18%
jan 1, 1991
0.268
-0.687
-71.95%
jan 1, 1992
0.268
+0.0
0.13%
jan 1, 1993
0.143
-0.125
-46.69%
jan 1, 1994
0.383
+0.24
167.56%
jan 1, 1995
0.099
-0.284
-74.15%
jan 1, 1996
0.281
+0.182
184.23%
jan 1, 1997
0.284
+0.003
0.94%
jan 1, 1998
0.225
-0.059
-20.8%
jan 1, 1999
0.123
-0.102
-45.39%
jan 1, 2000
0.329
+0.207
168.48%
jan 1, 2001
0.247
-0.082
-24.95%
jan 1, 2002
0.16
-0.087
-35.08%
jan 1, 2003
0.182
+0.022
13.54%
jan 1, 2004
0.379
+0.197
108.17%
jan 1, 2005
0.506
+0.126
33.3%
jan 1, 2006
0.431
-0.075
-14.78%
jan 1, 2007
0.375
-0.056
-13.05%
jan 1, 2008
0.328
-0.047
-12.43%
jan 1, 2009
0.291
-0.037
-11.23%
jan 1, 2010
0.284
-0.007
-2.54%
jan 1, 2011
0.277
-0.007
-2.32%
jan 1, 2012
0.428
+0.15
54.22%
jan 1, 2013
0.848
+0.421
98.35%
jan 1, 2014
1.443
+0.595
70.17%
jan 1, 2015
2.335
+0.892
61.8%
Ranking of countries by current statistics by years


Comments: