29
/
en
AIzaSyAYiBZKx7MnpbEhh9jyipgxe19OcubqV5w
April 1, 2024
27487
East Asia & Pacific
EAS
false
2
1
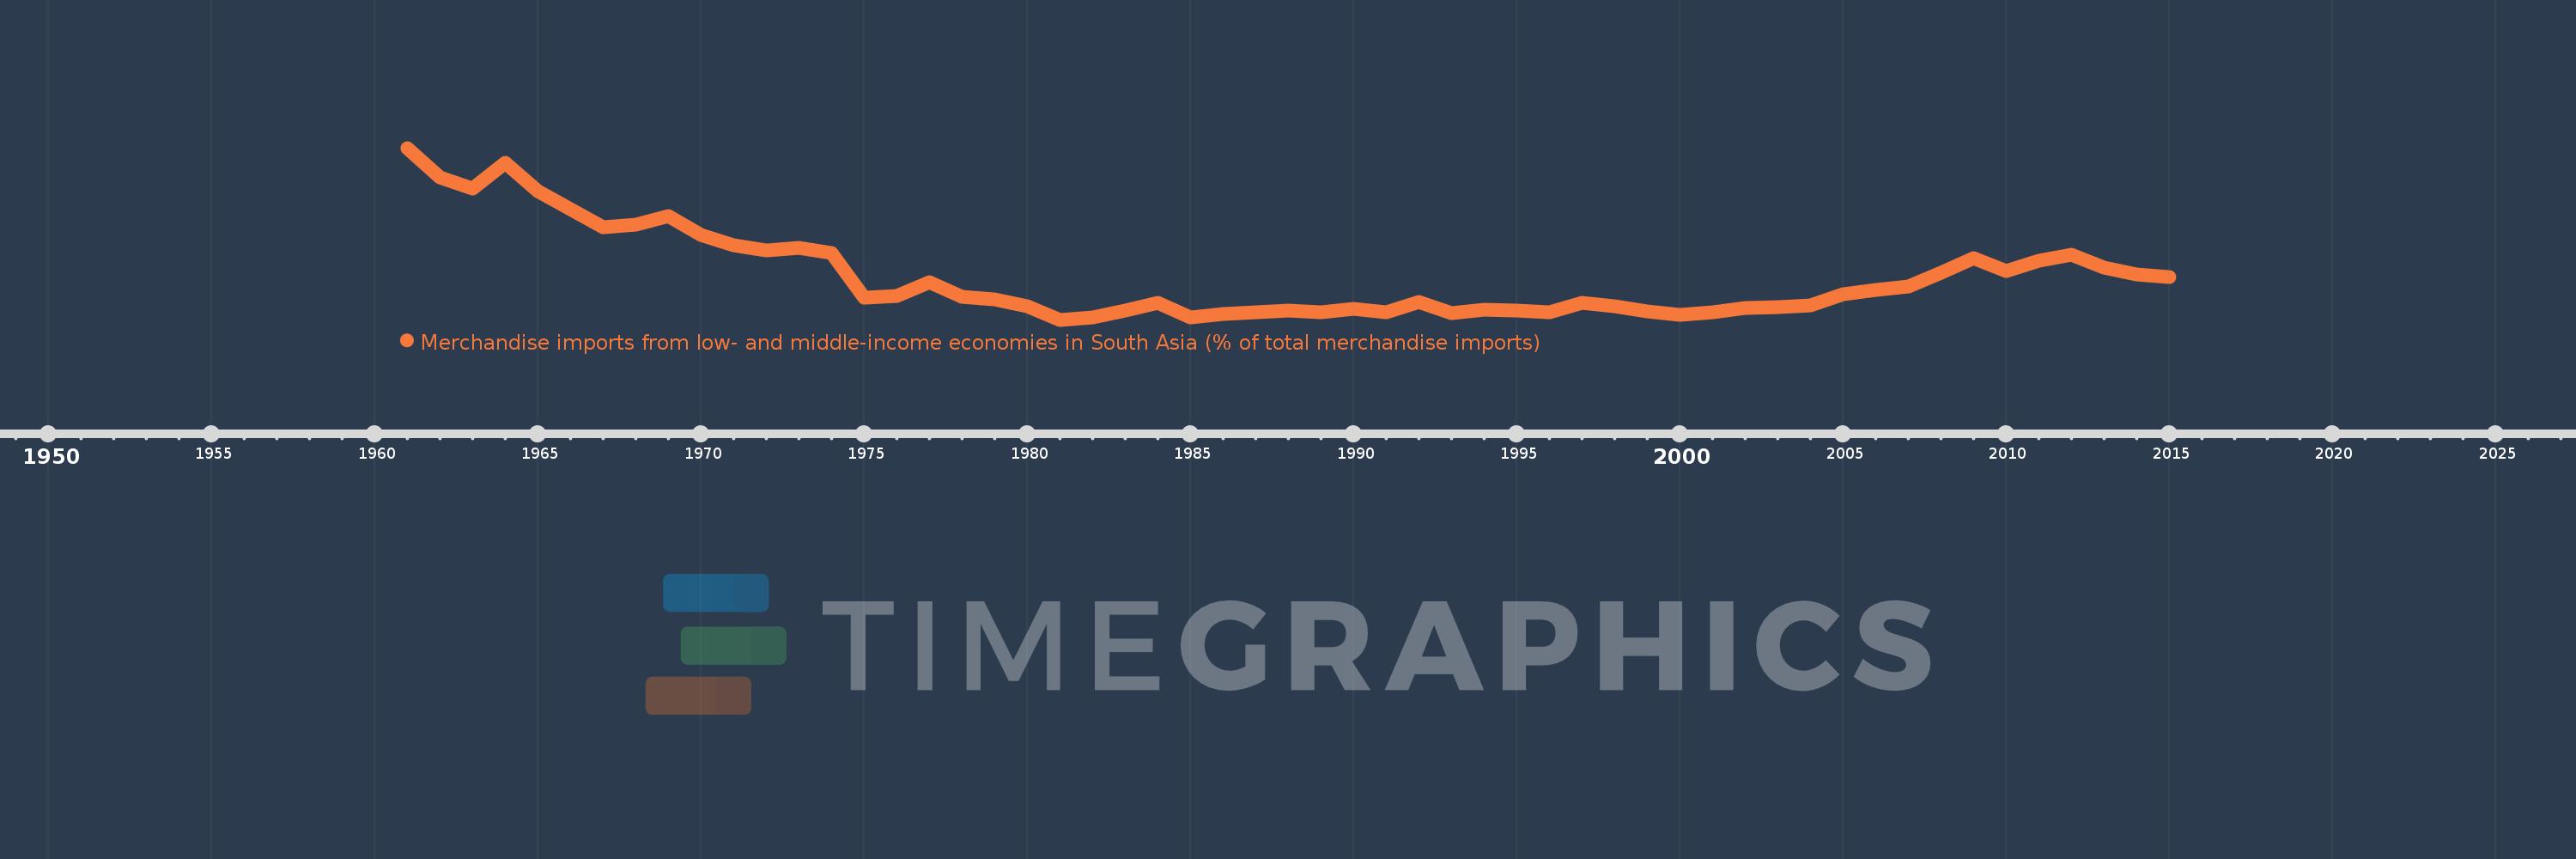
Merchandise imports from low- and middle-income economies in South Asia (% of total merchandise imports)
2015,2014,2013,2012,2011,2010,2009,2008,2007,2006,2005,2004,2003,2002,2001,2000,1999,1998,1997,1996,1995,1994,1993,1992,1991,1990,1989,1988,1987,1986,1985,1984,1983,1982,1981,1980,1979,1978,1977,1976,1975,1974,1973,1972,1971,1970,1969,1968,1967,1966,1965,1964,1963,1962,1961
This statistics in other country:
AfghanistanAlbaniaAlgeriaAngolaAntigua and BarbudaArab WorldArgentinaArmeniaArubaAustraliaAustriaAzerbaijanBahamas, TheBahrainBangladeshBarbadosBelarusBelgiumBelizeBeninBermudaBoliviaBrazilBrunei DarussalamBulgariaBurkina FasoBurundiCabo VerdeCambodiaCameroonCanadaCaribbean small statesCentral African RepublicCentral Europe and the BalticsChadChileChinaColombiaCongo, Dem. Rep.Congo, Rep.Costa RicaCote d'IvoireCroatiaCubaCyprusCzech RepublicDenmarkDjiboutiDominicaDominican RepublicEarly-demographic dividendEast Asia & PacificEast Asia & Pacific (excluding high income)East Asia & Pacific (IDA & IBRD countries)EcuadorEgypt, Arab Rep.El SalvadorEstoniaEthiopiaEuro areaEurope & Central AsiaEurope & Central Asia (excluding high income)Europe & Central Asia (IDA & IBRD countries)European UnionFaroe IslandsFijiFinlandFragile and conflict affected situationsFranceGabonGambia, TheGeorgiaGermanyGhanaGibraltarGreeceGreenlandGrenadaGuatemalaGuineaGuyanaHaitiHeavily indebted poor countries (HIPC)High incomeHondurasHong Kong SAR, ChinaHungaryIBRD onlyIcelandIDA & IBRD totalIDA blendIDA onlyIDA totalIndiaIndonesiaIran, Islamic Rep.IraqIrelandIsraelItalyJamaicaJapanJordanKazakhstanKenyaKiribatiKorea, Dem. People’s Rep.Korea, Rep.KosovoKuwaitKyrgyz RepublicLao PDRLate-demographic dividendLatin America & Caribbean Latin America & Caribbean (excluding high income)Latin America & the Caribbean (IDA & IBRD countries)LatviaLeast developed countries: UN classificationLebanonLiberiaLibyaLithuaniaLow & middle incomeLow incomeLower middle incomeLuxembourgMacao SAR, ChinaMacedonia, FYRMadagascarMalawiMalaysiaMaldivesMaliMaltaMauritaniaMauritiusMexicoMiddle East & North AfricaMiddle East & North Africa (excluding high income)Middle East & North Africa (IDA & IBRD countries)Middle incomeMoldovaMongoliaMontenegroMoroccoMozambiqueMyanmarNauruNepalNetherlandsNew CaledoniaNew ZealandNicaraguaNigerNigeriaNorth AmericaNorwayOECD membersOmanOther small statesPacific island small statesPakistanPanamaPapua New GuineaParaguayPeruPhilippinesPolandPortugalPost-demographic dividendPre-demographic dividendQatarRomaniaRussian FederationRwandaSamoaSaudi ArabiaSenegalSerbiaSeychellesSierra LeoneSingaporeSlovak RepublicSloveniaSmall statesSolomon IslandsSomaliaSouth AfricaSouth AsiaSouth Asia (IDA & IBRD)SpainSri LankaSt. Kitts and NevisSt. LuciaSt. Vincent and the GrenadinesSub-Saharan Africa Sub-Saharan Africa (excluding high income)Sub-Saharan Africa (IDA & IBRD countries)SudanSurinameSwedenSwitzerlandSyrian Arab RepublicTajikistanTanzaniaThailandTogoTongaTrinidad and TobagoTunisiaTurkeyTurkmenistanUgandaUkraineUnited Arab EmiratesUnited KingdomUnited StatesUpper middle incomeUruguayUzbekistanVanuatuVenezuela, RBVietnamWorldYemen, Rep.ZambiaZimbabwe Timeline:
This timeline shows a graph from 1961 to 2015 of East Asia & Pacific. No data until 1960. Number of actual observations by date: 55.
Source name:
World Development Indicators
Source organization:
World Bank staff estimates based data from International Monetary Fund's Direction of Trade database.
Categories, topics:
Private Sector, Trade
Last updated:
apr 23, 2017
Indicators value changes by year
At the date of observation
Value
Absolute change
Change from previous value
jan 1, 1961
3.154
+3.154
0.0%
jan 1, 1962
2.765
-0.389
-12.34%
jan 1, 1963
2.621
-0.143
-5.18%
jan 1, 1964
2.953
+0.331
12.64%
jan 1, 1965
2.588
-0.365
-12.37%
jan 1, 1966
2.35
-0.237
-9.17%
jan 1, 1967
2.105
-0.246
-10.46%
jan 1, 1968
2.144
+0.04
1.89%
jan 1, 1969
2.254
+0.109
5.1%
jan 1, 1970
2.013
-0.241
-10.68%
jan 1, 1971
1.872
-0.141
-7.01%
jan 1, 1972
1.805
-0.067
-3.58%
jan 1, 1973
1.842
+0.037
2.05%
jan 1, 1974
1.766
-0.076
-4.1%
jan 1, 1975
1.187
-0.58
-32.82%
jan 1, 1976
1.199
+0.012
1.04%
jan 1, 1977
1.381
+0.182
15.14%
jan 1, 1978
1.19
-0.19
-13.78%
jan 1, 1979
1.154
-0.037
-3.07%
jan 1, 1980
1.064
-0.09
-7.79%
jan 1, 1981
0.891
-0.173
-16.25%
jan 1, 1982
0.916
+0.025
2.76%
jan 1, 1983
1.01
+0.094
10.31%
jan 1, 1984
1.117
+0.107
10.59%
jan 1, 1985
0.918
-0.199
-17.83%
jan 1, 1986
0.962
+0.044
4.79%
jan 1, 1987
0.986
+0.024
2.48%
jan 1, 1988
1.014
+0.028
2.87%
jan 1, 1989
0.984
-0.03
-2.98%
jan 1, 1990
1.031
+0.047
4.83%
jan 1, 1991
0.994
-0.037
-3.61%
jan 1, 1992
1.122
+0.128
12.92%
jan 1, 1993
0.977
-0.145
-12.92%
jan 1, 1994
1.02
+0.043
4.37%
jan 1, 1995
1.009
-0.011
-1.05%
jan 1, 1996
0.987
-0.022
-2.2%
jan 1, 1997
1.117
+0.13
13.2%
jan 1, 1998
1.063
-0.055
-4.9%
jan 1, 1999
1.0
-0.063
-5.93%
jan 1, 2000
0.958
-0.042
-4.21%
jan 1, 2001
0.985
+0.027
2.86%
jan 1, 2002
1.043
+0.058
5.93%
jan 1, 2003
1.061
+0.018
1.73%
jan 1, 2004
1.081
+0.019
1.81%
jan 1, 2005
1.23
+0.149
13.81%
jan 1, 2006
1.279
+0.049
3.96%
jan 1, 2007
1.325
+0.047
3.65%
jan 1, 2008
1.514
+0.189
14.26%
jan 1, 2009
1.697
+0.183
12.09%
jan 1, 2010
1.538
-0.159
-9.39%
jan 1, 2011
1.667
+0.128
8.35%
jan 1, 2012
1.747
+0.081
4.84%
jan 1, 2013
1.576
-0.171
-9.79%
jan 1, 2014
1.488
-0.088
-5.56%
jan 1, 2015
1.45
-0.039
-2.6%
Ranking of countries by current statistics by years


Comments: