29
/
en
AIzaSyAYiBZKx7MnpbEhh9jyipgxe19OcubqV5w
April 1, 2024
52059
North America
NAC
false
2
1
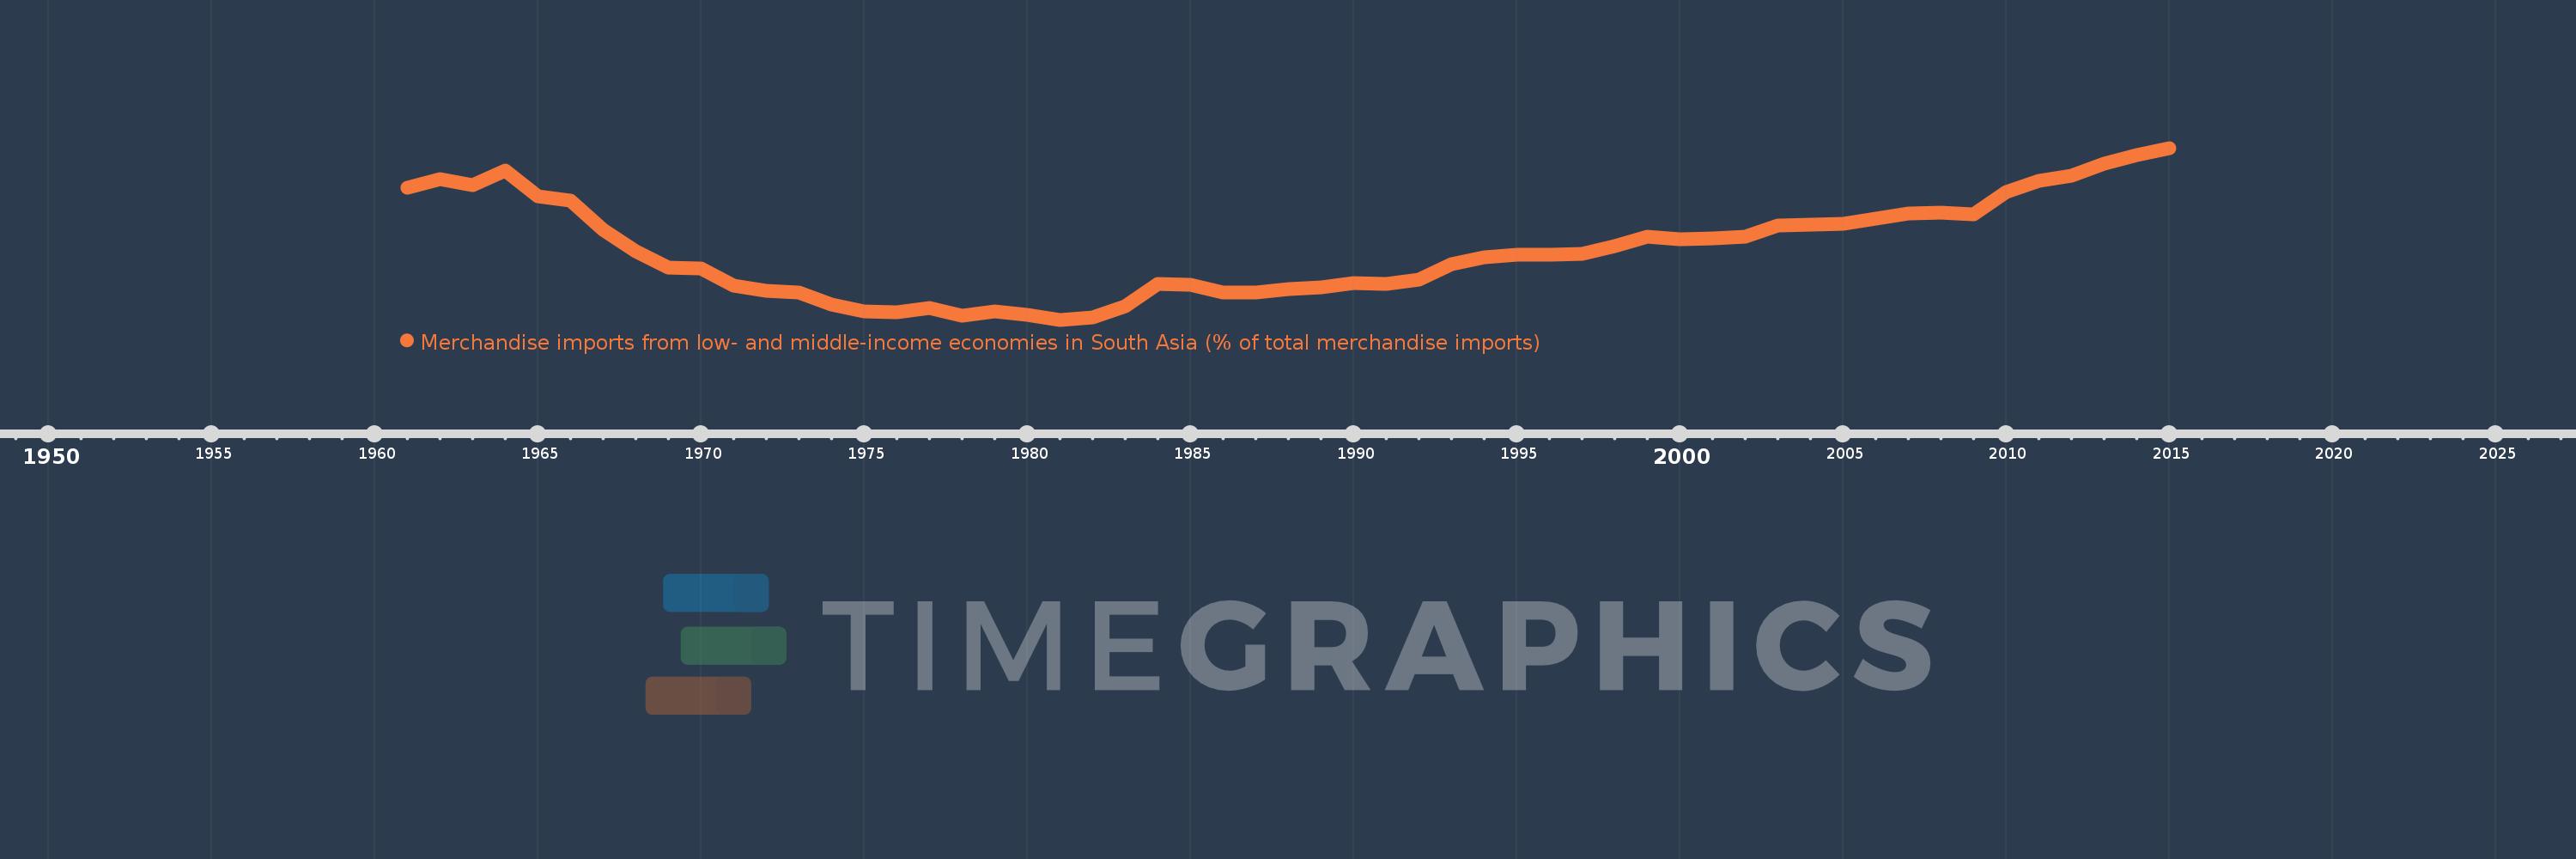
Merchandise imports from low- and middle-income economies in South Asia (% of total merchandise imports)
2015,2014,2013,2012,2011,2010,2009,2008,2007,2006,2005,2004,2003,2002,2001,2000,1999,1998,1997,1996,1995,1994,1993,1992,1991,1990,1989,1988,1987,1986,1985,1984,1983,1982,1981,1980,1979,1978,1977,1976,1975,1974,1973,1972,1971,1970,1969,1968,1967,1966,1965,1964,1963,1962,1961
This statistics in other country:
AfghanistanAlbaniaAlgeriaAngolaAntigua and BarbudaArab WorldArgentinaArmeniaArubaAustraliaAustriaAzerbaijanBahamas, TheBahrainBangladeshBarbadosBelarusBelgiumBelizeBeninBermudaBoliviaBrazilBrunei DarussalamBulgariaBurkina FasoBurundiCabo VerdeCambodiaCameroonCanadaCaribbean small statesCentral African RepublicCentral Europe and the BalticsChadChileChinaColombiaCongo, Dem. Rep.Congo, Rep.Costa RicaCote d'IvoireCroatiaCubaCyprusCzech RepublicDenmarkDjiboutiDominicaDominican RepublicEarly-demographic dividendEast Asia & PacificEast Asia & Pacific (excluding high income)East Asia & Pacific (IDA & IBRD countries)EcuadorEgypt, Arab Rep.El SalvadorEstoniaEthiopiaEuro areaEurope & Central AsiaEurope & Central Asia (excluding high income)Europe & Central Asia (IDA & IBRD countries)European UnionFaroe IslandsFijiFinlandFragile and conflict affected situationsFranceGabonGambia, TheGeorgiaGermanyGhanaGibraltarGreeceGreenlandGrenadaGuatemalaGuineaGuyanaHaitiHeavily indebted poor countries (HIPC)High incomeHondurasHong Kong SAR, ChinaHungaryIBRD onlyIcelandIDA & IBRD totalIDA blendIDA onlyIDA totalIndiaIndonesiaIran, Islamic Rep.IraqIrelandIsraelItalyJamaicaJapanJordanKazakhstanKenyaKiribatiKorea, Dem. People’s Rep.Korea, Rep.KosovoKuwaitKyrgyz RepublicLao PDRLate-demographic dividendLatin America & Caribbean Latin America & Caribbean (excluding high income)Latin America & the Caribbean (IDA & IBRD countries)LatviaLeast developed countries: UN classificationLebanonLiberiaLibyaLithuaniaLow & middle incomeLow incomeLower middle incomeLuxembourgMacao SAR, ChinaMacedonia, FYRMadagascarMalawiMalaysiaMaldivesMaliMaltaMauritaniaMauritiusMexicoMiddle East & North AfricaMiddle East & North Africa (excluding high income)Middle East & North Africa (IDA & IBRD countries)Middle incomeMoldovaMongoliaMontenegroMoroccoMozambiqueMyanmarNauruNepalNetherlandsNew CaledoniaNew ZealandNicaraguaNigerNigeriaNorth AmericaNorwayOECD membersOmanOther small statesPacific island small statesPakistanPanamaPapua New GuineaParaguayPeruPhilippinesPolandPortugalPost-demographic dividendPre-demographic dividendQatarRomaniaRussian FederationRwandaSamoaSaudi ArabiaSenegalSerbiaSeychellesSierra LeoneSingaporeSlovak RepublicSloveniaSmall statesSolomon IslandsSomaliaSouth AfricaSouth AsiaSouth Asia (IDA & IBRD)SpainSri LankaSt. Kitts and NevisSt. LuciaSt. Vincent and the GrenadinesSub-Saharan Africa Sub-Saharan Africa (excluding high income)Sub-Saharan Africa (IDA & IBRD countries)SudanSurinameSwedenSwitzerlandSyrian Arab RepublicTajikistanTanzaniaThailandTogoTongaTrinidad and TobagoTunisiaTurkeyTurkmenistanUgandaUkraineUnited Arab EmiratesUnited KingdomUnited StatesUpper middle incomeUruguayUzbekistanVanuatuVenezuela, RBVietnamWorldYemen, Rep.ZambiaZimbabwe Timeline:
This timeline shows a graph from 1961 to 2015 of North America. No data until 1960. Number of actual observations by date: 55.
Source name:
World Development Indicators
Source organization:
World Bank staff estimates based data from International Monetary Fund's Direction of Trade database.
Categories, topics:
Private Sector, Trade
Last updated:
apr 23, 2017
Indicators value changes by year
At the date of observation
Value
Absolute change
Change from previous value
jan 1, 1961
1.79
+1.79
0.0%
jan 1, 1962
1.87
+0.08
4.45%
jan 1, 1963
1.811
-0.058
-3.12%
jan 1, 1964
1.952
+0.141
7.77%
jan 1, 1965
1.707
-0.245
-12.56%
jan 1, 1966
1.668
-0.038
-2.24%
jan 1, 1967
1.387
-0.281
-16.85%
jan 1, 1968
1.185
-0.202
-14.55%
jan 1, 1969
1.03
-0.155
-13.09%
jan 1, 1970
1.018
-0.013
-1.23%
jan 1, 1971
0.861
-0.157
-15.39%
jan 1, 1972
0.808
-0.052
-6.09%
jan 1, 1973
0.792
-0.017
-2.05%
jan 1, 1974
0.678
-0.114
-14.39%
jan 1, 1975
0.616
-0.062
-9.13%
jan 1, 1976
0.608
-0.008
-1.34%
jan 1, 1977
0.646
+0.038
6.21%
jan 1, 1978
0.575
-0.071
-10.92%
jan 1, 1979
0.615
+0.04
6.92%
jan 1, 1980
0.579
-0.036
-5.88%
jan 1, 1981
0.534
-0.045
-7.7%
jan 1, 1982
0.558
+0.023
4.38%
jan 1, 1983
0.666
+0.108
19.4%
jan 1, 1984
0.878
+0.212
31.85%
jan 1, 1985
0.87
-0.008
-0.86%
jan 1, 1986
0.797
-0.073
-8.38%
jan 1, 1987
0.791
-0.006
-0.75%
jan 1, 1988
0.826
+0.035
4.4%
jan 1, 1989
0.846
+0.019
2.36%
jan 1, 1990
0.882
+0.036
4.26%
jan 1, 1991
0.871
-0.011
-1.25%
jan 1, 1992
0.915
+0.045
5.13%
jan 1, 1993
1.063
+0.147
16.1%
jan 1, 1994
1.125
+0.063
5.91%
jan 1, 1995
1.153
+0.027
2.43%
jan 1, 1996
1.149
-0.004
-0.35%
jan 1, 1997
1.163
+0.014
1.22%
jan 1, 1998
1.238
+0.076
6.5%
jan 1, 1999
1.328
+0.09
7.26%
jan 1, 2000
1.303
-0.025
-1.88%
jan 1, 2001
1.309
+0.006
0.45%
jan 1, 2002
1.323
+0.014
1.03%
jan 1, 2003
1.431
+0.108
8.16%
jan 1, 2004
1.441
+0.011
0.74%
jan 1, 2005
1.444
+0.003
0.2%
jan 1, 2006
1.494
+0.05
3.46%
jan 1, 2007
1.548
+0.054
3.6%
jan 1, 2008
1.553
+0.006
0.37%
jan 1, 2009
1.54
-0.014
-0.89%
jan 1, 2010
1.746
+0.206
13.4%
jan 1, 2011
1.854
+0.108
6.21%
jan 1, 2012
1.903
+0.049
2.64%
jan 1, 2013
2.022
+0.119
6.23%
jan 1, 2014
2.103
+0.081
4.01%
jan 1, 2015
2.169
+0.067
3.16%
Ranking of countries by current statistics by years


Comments: