29
/
en
AIzaSyAYiBZKx7MnpbEhh9jyipgxe19OcubqV5w
April 1, 2024
87531
Bolivia
BOL
true
2
1
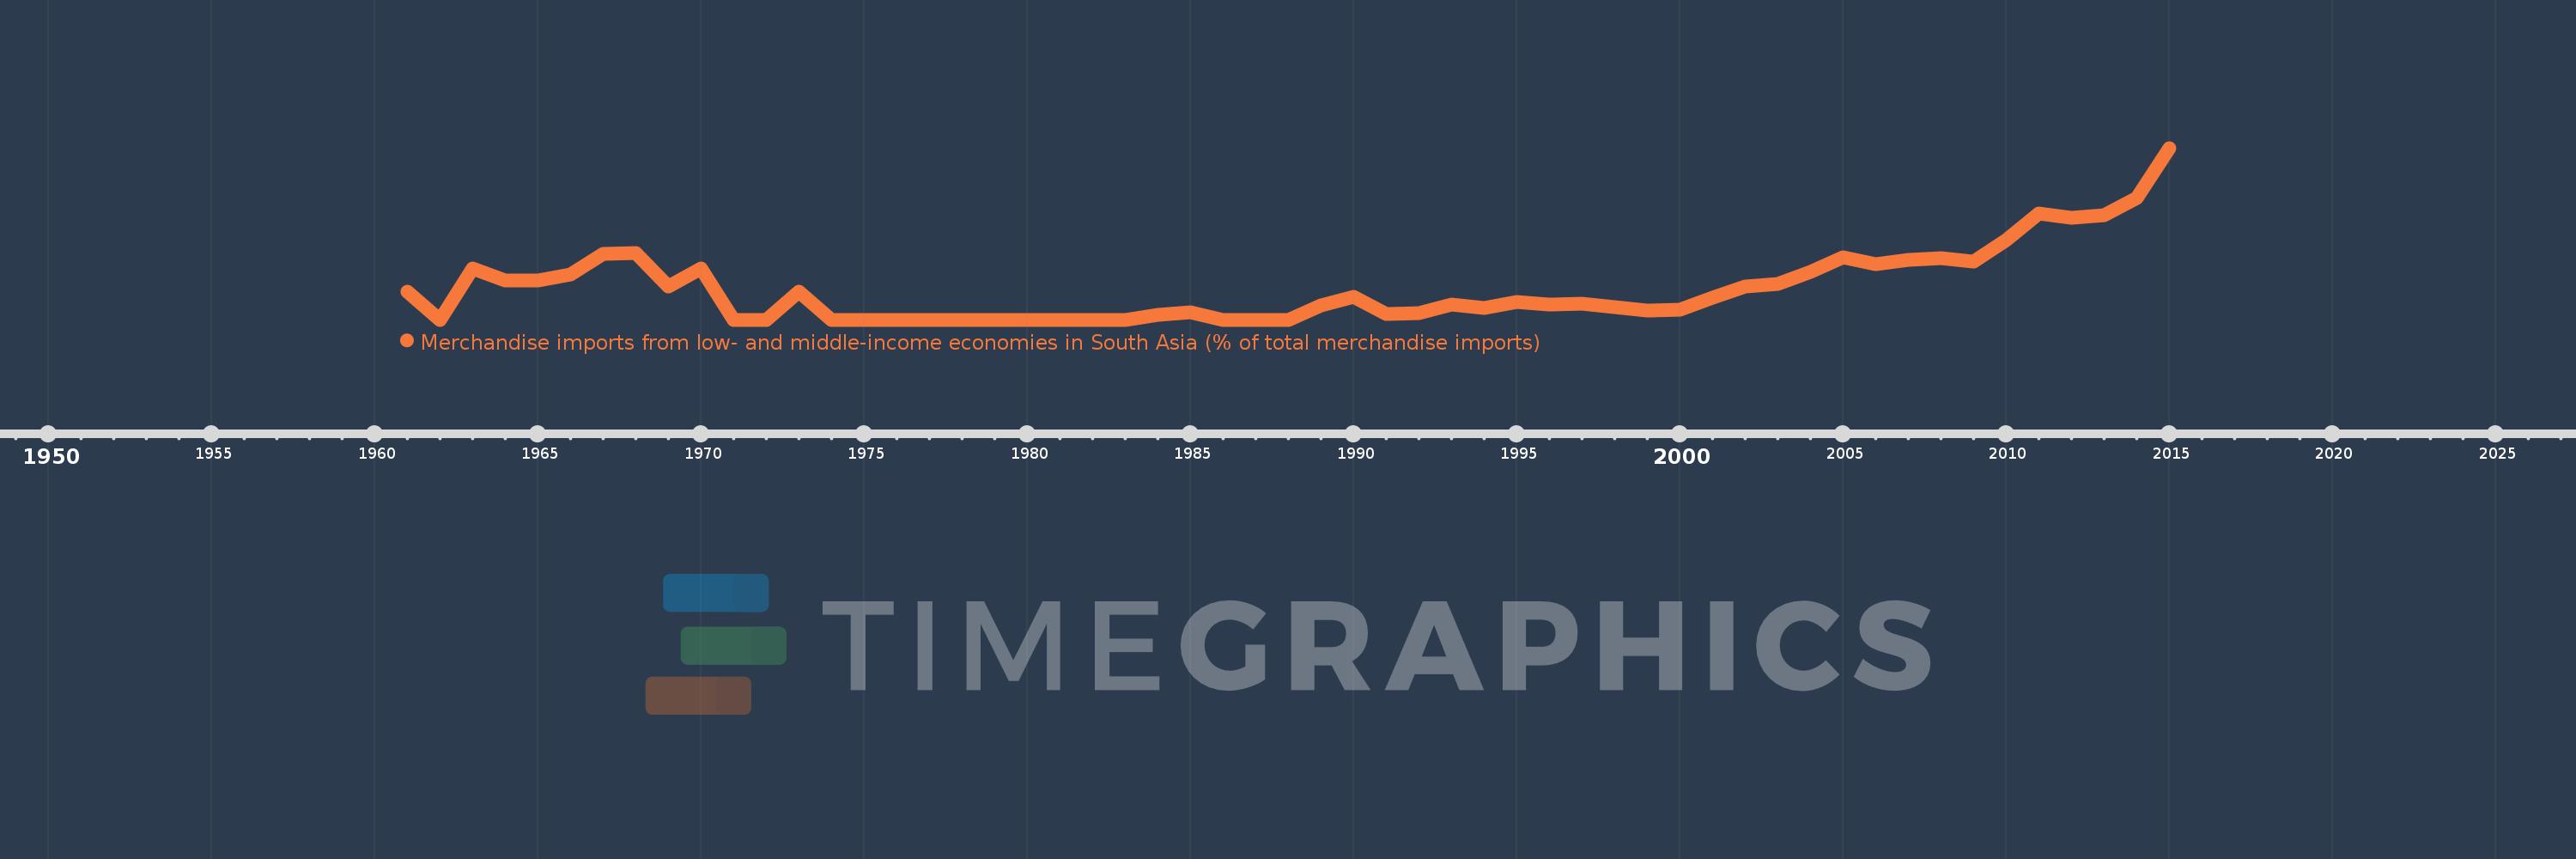
Merchandise imports from low- and middle-income economies in South Asia (% of total merchandise imports)
2015,2014,2013,2012,2011,2010,2009,2008,2007,2006,2005,2004,2003,2002,2001,2000,1999,1998,1997,1996,1995,1994,1993,1992,1991,1990,1989,1988,1987,1986,1985,1984,1983,1982,1981,1980,1979,1978,1977,1976,1975,1974,1973,1972,1971,1970,1969,1968,1967,1966,1965,1964,1963,1962,1961
This statistics in other country:
AfghanistanAlbaniaAlgeriaAngolaAntigua and BarbudaArab WorldArgentinaArmeniaArubaAustraliaAustriaAzerbaijanBahamas, TheBahrainBangladeshBarbadosBelarusBelgiumBelizeBeninBermudaBoliviaBrazilBrunei DarussalamBulgariaBurkina FasoBurundiCabo VerdeCambodiaCameroonCanadaCaribbean small statesCentral African RepublicCentral Europe and the BalticsChadChileChinaColombiaCongo, Dem. Rep.Congo, Rep.Costa RicaCote d'IvoireCroatiaCubaCyprusCzech RepublicDenmarkDjiboutiDominicaDominican RepublicEarly-demographic dividendEast Asia & PacificEast Asia & Pacific (excluding high income)East Asia & Pacific (IDA & IBRD countries)EcuadorEgypt, Arab Rep.El SalvadorEstoniaEthiopiaEuro areaEurope & Central AsiaEurope & Central Asia (excluding high income)Europe & Central Asia (IDA & IBRD countries)European UnionFaroe IslandsFijiFinlandFragile and conflict affected situationsFranceGabonGambia, TheGeorgiaGermanyGhanaGibraltarGreeceGreenlandGrenadaGuatemalaGuineaGuyanaHaitiHeavily indebted poor countries (HIPC)High incomeHondurasHong Kong SAR, ChinaHungaryIBRD onlyIcelandIDA & IBRD totalIDA blendIDA onlyIDA totalIndiaIndonesiaIran, Islamic Rep.IraqIrelandIsraelItalyJamaicaJapanJordanKazakhstanKenyaKiribatiKorea, Dem. People’s Rep.Korea, Rep.KosovoKuwaitKyrgyz RepublicLao PDRLate-demographic dividendLatin America & Caribbean Latin America & Caribbean (excluding high income)Latin America & the Caribbean (IDA & IBRD countries)LatviaLeast developed countries: UN classificationLebanonLiberiaLibyaLithuaniaLow & middle incomeLow incomeLower middle incomeLuxembourgMacao SAR, ChinaMacedonia, FYRMadagascarMalawiMalaysiaMaldivesMaliMaltaMauritaniaMauritiusMexicoMiddle East & North AfricaMiddle East & North Africa (excluding high income)Middle East & North Africa (IDA & IBRD countries)Middle incomeMoldovaMongoliaMontenegroMoroccoMozambiqueMyanmarNauruNepalNetherlandsNew CaledoniaNew ZealandNicaraguaNigerNigeriaNorth AmericaNorwayOECD membersOmanOther small statesPacific island small statesPakistanPanamaPapua New GuineaParaguayPeruPhilippinesPolandPortugalPost-demographic dividendPre-demographic dividendQatarRomaniaRussian FederationRwandaSamoaSaudi ArabiaSenegalSerbiaSeychellesSierra LeoneSingaporeSlovak RepublicSloveniaSmall statesSolomon IslandsSomaliaSouth AfricaSouth AsiaSouth Asia (IDA & IBRD)SpainSri LankaSt. Kitts and NevisSt. LuciaSt. Vincent and the GrenadinesSub-Saharan Africa Sub-Saharan Africa (excluding high income)Sub-Saharan Africa (IDA & IBRD countries)SudanSurinameSwedenSwitzerlandSyrian Arab RepublicTajikistanTanzaniaThailandTogoTongaTrinidad and TobagoTunisiaTurkeyTurkmenistanUgandaUkraineUnited Arab EmiratesUnited KingdomUnited StatesUpper middle incomeUruguayUzbekistanVanuatuVenezuela, RBVietnamWorldYemen, Rep.ZambiaZimbabwe Timeline:
This timeline shows a graph from 1961 to 2015 of Bolivia. No data until 1960. Number of actual observations by date: 55.
Source name:
World Development Indicators
Source organization:
World Bank staff estimates based data from International Monetary Fund's Direction of Trade database.
Categories, topics:
Private Sector, Trade
Last updated:
apr 23, 2017
Indicators value changes by year
At the date of observation
Value
Absolute change
Change from previous value
jan 1, 1961
0.281
+0.281
0.0%
jan 1, 1962
0.0
-0.281
-100.0%
jan 1, 1963
0.511
+0.511
%
jan 1, 1964
0.385
-0.125
-24.55%
jan 1, 1965
0.389
+0.003
0.87%
jan 1, 1966
0.447
+0.059
15.1%
jan 1, 1967
0.65
+0.202
45.23%
jan 1, 1968
0.661
+0.012
1.78%
jan 1, 1969
0.328
-0.334
-50.44%
jan 1, 1970
0.507
+0.179
54.57%
jan 1, 1971
0.0
-0.507
-100.0%
jan 1, 1973
0.282
+0.282
%
jan 1, 1974
0.0
-0.282
-100.0%
jan 1, 1985
0.072
+0.022
44.38%
jan 1, 1986
0.0
-0.072
-100.0%
jan 1, 1989
0.139
+0.139
%
jan 1, 1990
0.23
+0.091
65.76%
jan 1, 1991
0.057
-0.173
-75.3%
jan 1, 1992
0.064
+0.007
12.77%
jan 1, 1993
0.154
+0.09
140.33%
jan 1, 1994
0.115
-0.038
-24.98%
jan 1, 1995
0.177
+0.062
53.82%
jan 1, 1996
0.147
-0.031
-17.21%
jan 1, 1997
0.157
+0.01
7.04%
jan 1, 1998
0.122
-0.035
-22.27%
jan 1, 1999
0.092
-0.03
-24.43%
jan 1, 2000
0.101
+0.009
9.62%
jan 1, 2001
0.219
+0.118
116.5%
jan 1, 2002
0.33
+0.11
50.36%
jan 1, 2003
0.356
+0.026
8.01%
jan 1, 2004
0.477
+0.121
33.91%
jan 1, 2005
0.62
+0.143
30.04%
jan 1, 2006
0.548
-0.072
-11.63%
jan 1, 2007
0.589
+0.041
7.47%
jan 1, 2008
0.607
+0.018
3.11%
jan 1, 2009
0.572
-0.036
-5.86%
jan 1, 2010
0.789
+0.218
38.08%
jan 1, 2011
1.049
+0.26
32.92%
jan 1, 2012
1.013
-0.036
-3.42%
jan 1, 2013
1.035
+0.022
2.13%
jan 1, 2014
1.202
+0.167
16.14%
jan 1, 2015
1.701
+0.499
41.53%
Ranking of countries by current statistics by years


Comments: