29
/
en
AIzaSyAYiBZKx7MnpbEhh9jyipgxe19OcubqV5w
April 1, 2024
161738
Italy
ITA
true
2
1
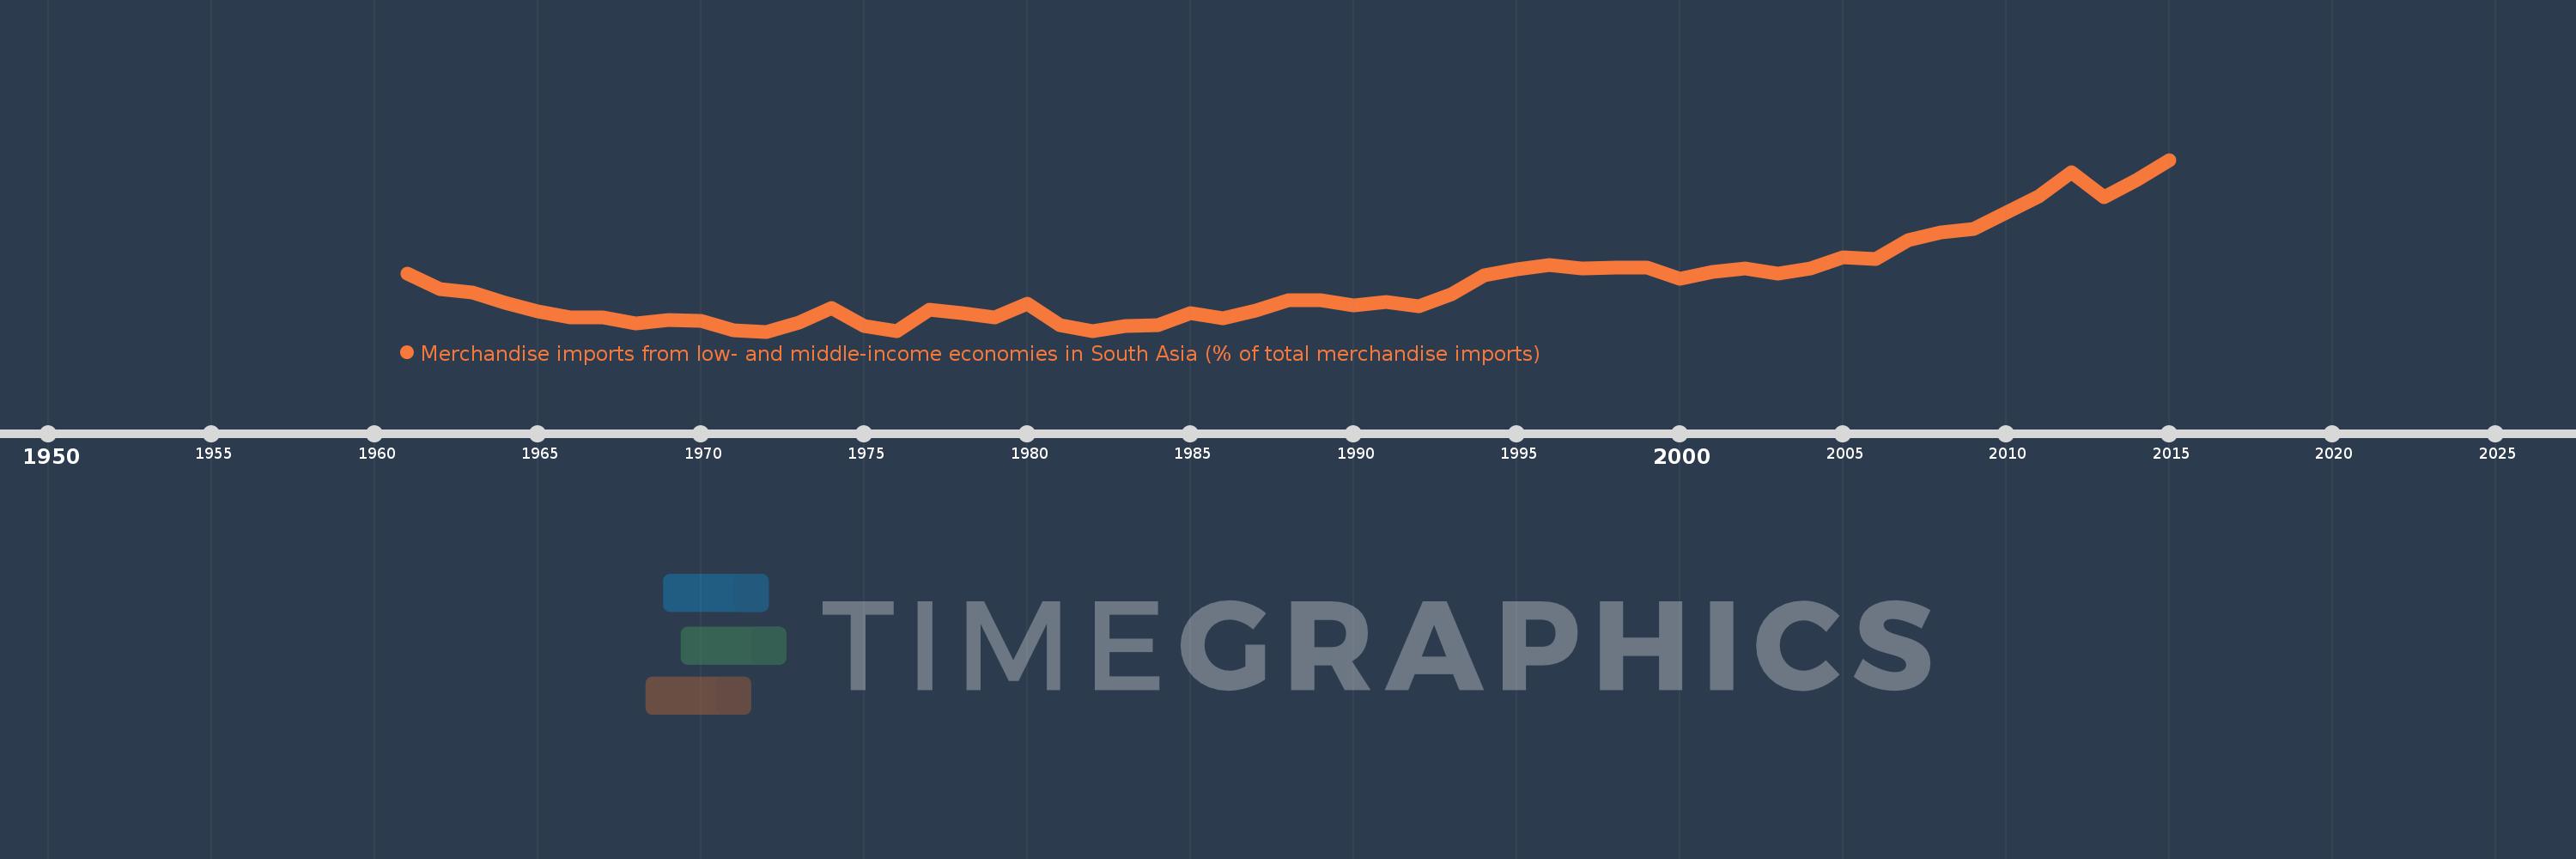
Merchandise imports from low- and middle-income economies in South Asia (% of total merchandise imports)
2015,2014,2013,2012,2011,2010,2009,2008,2007,2006,2005,2004,2003,2002,2001,2000,1999,1998,1997,1996,1995,1994,1993,1992,1991,1990,1989,1988,1987,1986,1985,1984,1983,1982,1981,1980,1979,1978,1977,1976,1975,1974,1973,1972,1971,1970,1969,1968,1967,1966,1965,1964,1963,1962,1961
This statistics in other country:
AfghanistanAlbaniaAlgeriaAngolaAntigua and BarbudaArab WorldArgentinaArmeniaArubaAustraliaAustriaAzerbaijanBahamas, TheBahrainBangladeshBarbadosBelarusBelgiumBelizeBeninBermudaBoliviaBrazilBrunei DarussalamBulgariaBurkina FasoBurundiCabo VerdeCambodiaCameroonCanadaCaribbean small statesCentral African RepublicCentral Europe and the BalticsChadChileChinaColombiaCongo, Dem. Rep.Congo, Rep.Costa RicaCote d'IvoireCroatiaCubaCyprusCzech RepublicDenmarkDjiboutiDominicaDominican RepublicEarly-demographic dividendEast Asia & PacificEast Asia & Pacific (excluding high income)East Asia & Pacific (IDA & IBRD countries)EcuadorEgypt, Arab Rep.El SalvadorEstoniaEthiopiaEuro areaEurope & Central AsiaEurope & Central Asia (excluding high income)Europe & Central Asia (IDA & IBRD countries)European UnionFaroe IslandsFijiFinlandFragile and conflict affected situationsFranceGabonGambia, TheGeorgiaGermanyGhanaGibraltarGreeceGreenlandGrenadaGuatemalaGuineaGuyanaHaitiHeavily indebted poor countries (HIPC)High incomeHondurasHong Kong SAR, ChinaHungaryIBRD onlyIcelandIDA & IBRD totalIDA blendIDA onlyIDA totalIndiaIndonesiaIran, Islamic Rep.IraqIrelandIsraelItalyJamaicaJapanJordanKazakhstanKenyaKiribatiKorea, Dem. People’s Rep.Korea, Rep.KosovoKuwaitKyrgyz RepublicLao PDRLate-demographic dividendLatin America & Caribbean Latin America & Caribbean (excluding high income)Latin America & the Caribbean (IDA & IBRD countries)LatviaLeast developed countries: UN classificationLebanonLiberiaLibyaLithuaniaLow & middle incomeLow incomeLower middle incomeLuxembourgMacao SAR, ChinaMacedonia, FYRMadagascarMalawiMalaysiaMaldivesMaliMaltaMauritaniaMauritiusMexicoMiddle East & North AfricaMiddle East & North Africa (excluding high income)Middle East & North Africa (IDA & IBRD countries)Middle incomeMoldovaMongoliaMontenegroMoroccoMozambiqueMyanmarNauruNepalNetherlandsNew CaledoniaNew ZealandNicaraguaNigerNigeriaNorth AmericaNorwayOECD membersOmanOther small statesPacific island small statesPakistanPanamaPapua New GuineaParaguayPeruPhilippinesPolandPortugalPost-demographic dividendPre-demographic dividendQatarRomaniaRussian FederationRwandaSamoaSaudi ArabiaSenegalSerbiaSeychellesSierra LeoneSingaporeSlovak RepublicSloveniaSmall statesSolomon IslandsSomaliaSouth AfricaSouth AsiaSouth Asia (IDA & IBRD)SpainSri LankaSt. Kitts and NevisSt. LuciaSt. Vincent and the GrenadinesSub-Saharan Africa Sub-Saharan Africa (excluding high income)Sub-Saharan Africa (IDA & IBRD countries)SudanSurinameSwedenSwitzerlandSyrian Arab RepublicTajikistanTanzaniaThailandTogoTongaTrinidad and TobagoTunisiaTurkeyTurkmenistanUgandaUkraineUnited Arab EmiratesUnited KingdomUnited StatesUpper middle incomeUruguayUzbekistanVanuatuVenezuela, RBVietnamWorldYemen, Rep.ZambiaZimbabwe Timeline:
This timeline shows a graph from 1961 to 2015 of Italy. No data until 1960. Number of actual observations by date: 55.
Source name:
World Development Indicators
Source organization:
World Bank staff estimates based data from International Monetary Fund's Direction of Trade database.
Categories, topics:
Private Sector, Trade
Last updated:
apr 23, 2017
Indicators value changes by year
At the date of observation
Value
Absolute change
Change from previous value
jan 1, 1961
0.873
+0.873
0.0%
jan 1, 1962
0.747
-0.127
-14.51%
jan 1, 1963
0.716
-0.031
-4.11%
jan 1, 1964
0.63
-0.086
-11.97%
jan 1, 1965
0.563
-0.067
-10.62%
jan 1, 1966
0.507
-0.056
-9.99%
jan 1, 1967
0.511
+0.004
0.85%
jan 1, 1968
0.459
-0.052
-10.26%
jan 1, 1969
0.486
+0.027
5.86%
jan 1, 1970
0.485
-0.001
-0.18%
jan 1, 1971
0.407
-0.078
-15.99%
jan 1, 1972
0.393
-0.015
-3.6%
jan 1, 1973
0.466
+0.074
18.75%
jan 1, 1974
0.586
+0.12
25.67%
jan 1, 1975
0.44
-0.146
-24.94%
jan 1, 1976
0.394
-0.046
-10.47%
jan 1, 1977
0.571
+0.177
44.93%
jan 1, 1978
0.542
-0.029
-5.02%
jan 1, 1979
0.512
-0.03
-5.55%
jan 1, 1980
0.623
+0.111
21.7%
jan 1, 1981
0.443
-0.18
-28.85%
jan 1, 1982
0.4
-0.044
-9.87%
jan 1, 1983
0.439
+0.039
9.72%
jan 1, 1984
0.445
+0.007
1.53%
jan 1, 1985
0.548
+0.103
23.08%
jan 1, 1986
0.505
-0.043
-7.84%
jan 1, 1987
0.565
+0.06
11.93%
jan 1, 1988
0.652
+0.087
15.39%
jan 1, 1989
0.65
-0.002
-0.38%
jan 1, 1990
0.61
-0.04
-6.11%
jan 1, 1991
0.636
+0.026
4.23%
jan 1, 1992
0.602
-0.034
-5.28%
jan 1, 1993
0.699
+0.097
16.1%
jan 1, 1994
0.856
+0.157
22.38%
jan 1, 1995
0.91
+0.054
6.34%
jan 1, 1996
0.945
+0.035
3.86%
jan 1, 1997
0.917
-0.028
-2.98%
jan 1, 1998
0.922
+0.005
0.54%
jan 1, 1999
0.925
+0.003
0.35%
jan 1, 2000
0.831
-0.095
-10.22%
jan 1, 2001
0.888
+0.057
6.87%
jan 1, 2002
0.913
+0.026
2.89%
jan 1, 2003
0.872
-0.041
-4.52%
jan 1, 2004
0.913
+0.041
4.7%
jan 1, 2005
1.007
+0.094
10.3%
jan 1, 2006
0.996
-0.011
-1.07%
jan 1, 2007
1.151
+0.154
15.5%
jan 1, 2008
1.209
+0.058
5.07%
jan 1, 2009
1.243
+0.034
2.82%
jan 1, 2010
1.378
+0.134
10.82%
jan 1, 2011
1.511
+0.133
9.68%
jan 1, 2012
1.706
+0.195
12.9%
jan 1, 2013
1.502
-0.204
-11.93%
jan 1, 2014
1.646
+0.144
9.55%
jan 1, 2015
1.812
+0.166
10.09%
Ranking of countries by current statistics by years


Comments: