29
/
en
AIzaSyAYiBZKx7MnpbEhh9jyipgxe19OcubqV5w
April 1, 2024
32831
Europe & Central Asia (IDA & IBRD countries)
TEC
false
2
1
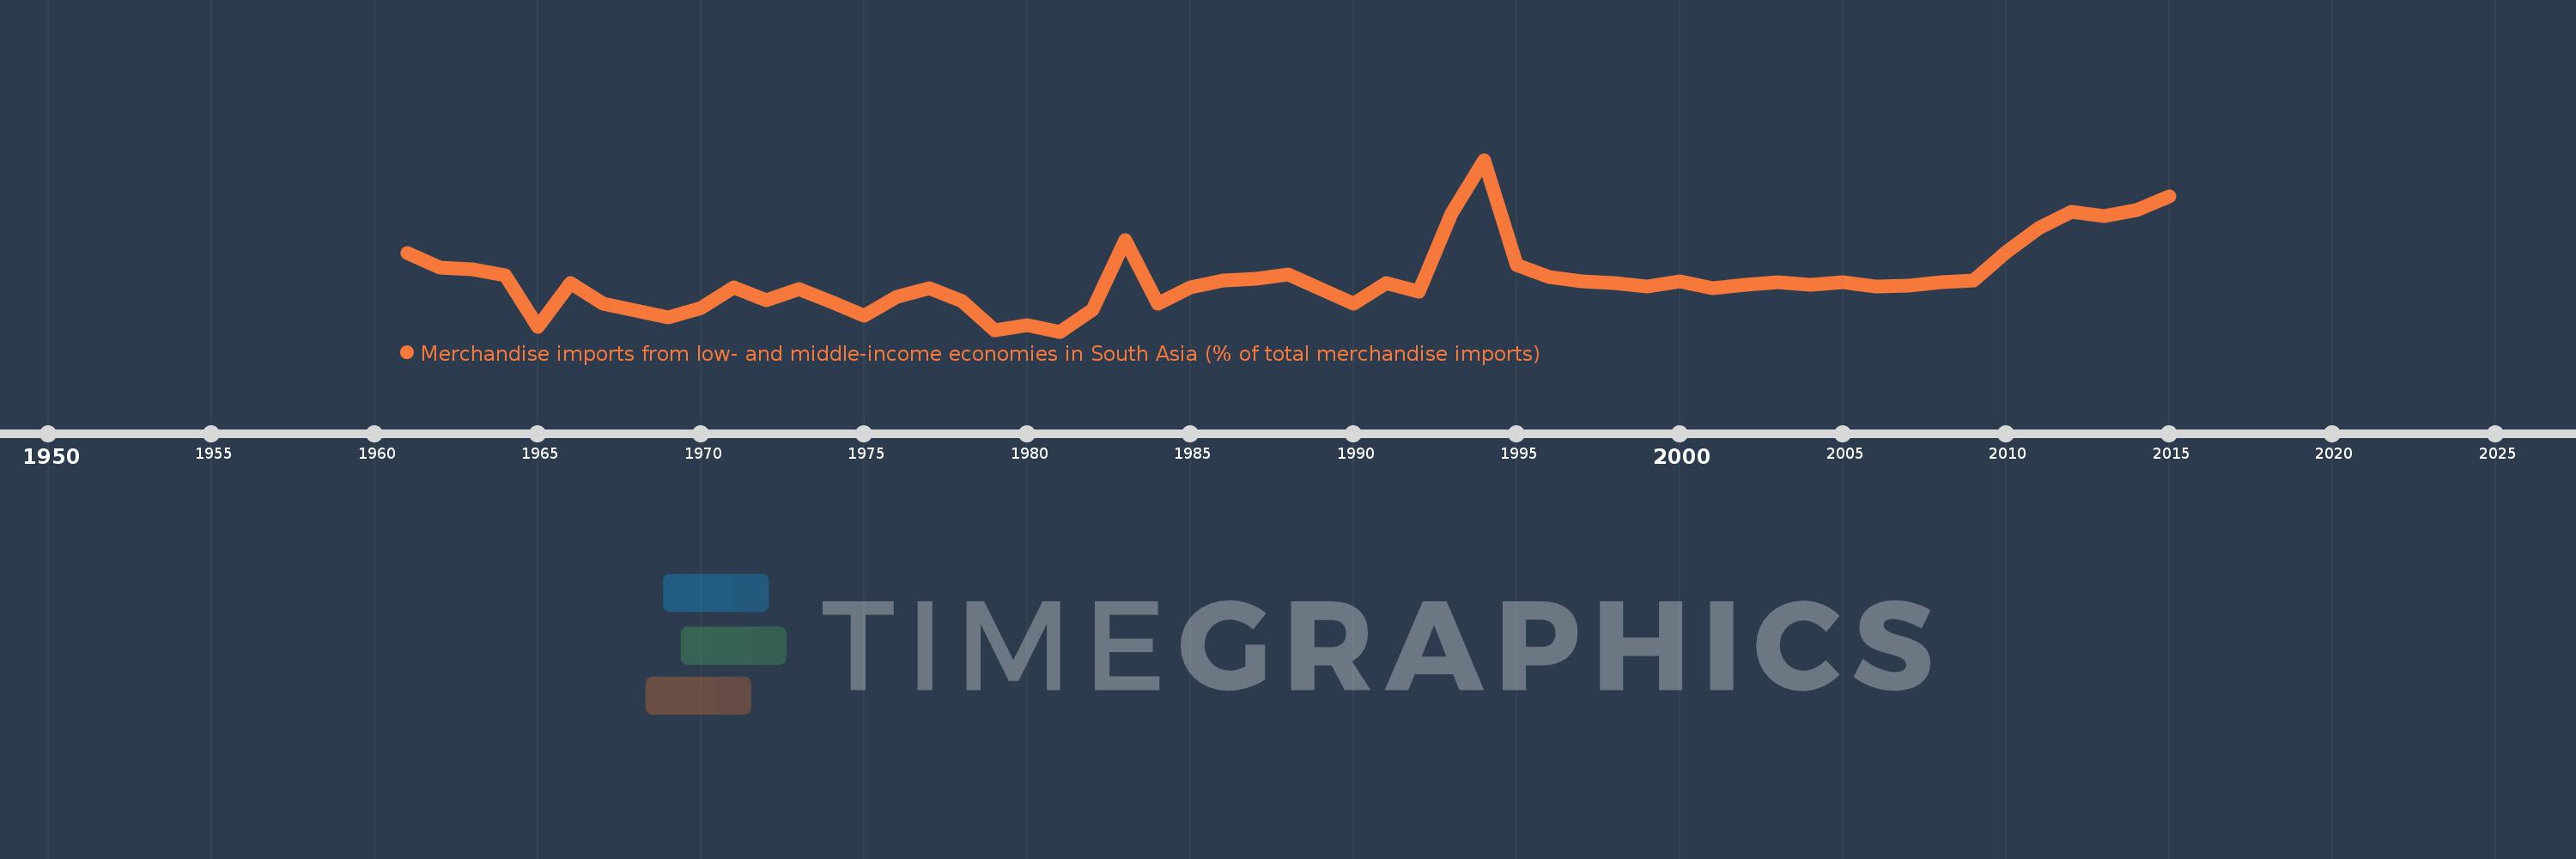
Merchandise imports from low- and middle-income economies in South Asia (% of total merchandise imports)
2015,2014,2013,2012,2011,2010,2009,2008,2007,2006,2005,2004,2003,2002,2001,2000,1999,1998,1997,1996,1995,1994,1993,1992,1991,1990,1989,1988,1987,1986,1985,1984,1983,1982,1981,1980,1979,1978,1977,1976,1975,1974,1973,1972,1971,1970,1969,1968,1967,1966,1965,1964,1963,1962,1961
This statistics in other country:
AfghanistanAlbaniaAlgeriaAngolaAntigua and BarbudaArab WorldArgentinaArmeniaArubaAustraliaAustriaAzerbaijanBahamas, TheBahrainBangladeshBarbadosBelarusBelgiumBelizeBeninBermudaBoliviaBrazilBrunei DarussalamBulgariaBurkina FasoBurundiCabo VerdeCambodiaCameroonCanadaCaribbean small statesCentral African RepublicCentral Europe and the BalticsChadChileChinaColombiaCongo, Dem. Rep.Congo, Rep.Costa RicaCote d'IvoireCroatiaCubaCyprusCzech RepublicDenmarkDjiboutiDominicaDominican RepublicEarly-demographic dividendEast Asia & PacificEast Asia & Pacific (excluding high income)East Asia & Pacific (IDA & IBRD countries)EcuadorEgypt, Arab Rep.El SalvadorEstoniaEthiopiaEuro areaEurope & Central AsiaEurope & Central Asia (excluding high income)Europe & Central Asia (IDA & IBRD countries)European UnionFaroe IslandsFijiFinlandFragile and conflict affected situationsFranceGabonGambia, TheGeorgiaGermanyGhanaGibraltarGreeceGreenlandGrenadaGuatemalaGuineaGuyanaHaitiHeavily indebted poor countries (HIPC)High incomeHondurasHong Kong SAR, ChinaHungaryIBRD onlyIcelandIDA & IBRD totalIDA blendIDA onlyIDA totalIndiaIndonesiaIran, Islamic Rep.IraqIrelandIsraelItalyJamaicaJapanJordanKazakhstanKenyaKiribatiKorea, Dem. People’s Rep.Korea, Rep.KosovoKuwaitKyrgyz RepublicLao PDRLate-demographic dividendLatin America & Caribbean Latin America & Caribbean (excluding high income)Latin America & the Caribbean (IDA & IBRD countries)LatviaLeast developed countries: UN classificationLebanonLiberiaLibyaLithuaniaLow & middle incomeLow incomeLower middle incomeLuxembourgMacao SAR, ChinaMacedonia, FYRMadagascarMalawiMalaysiaMaldivesMaliMaltaMauritaniaMauritiusMexicoMiddle East & North AfricaMiddle East & North Africa (excluding high income)Middle East & North Africa (IDA & IBRD countries)Middle incomeMoldovaMongoliaMontenegroMoroccoMozambiqueMyanmarNauruNepalNetherlandsNew CaledoniaNew ZealandNicaraguaNigerNigeriaNorth AmericaNorwayOECD membersOmanOther small statesPacific island small statesPakistanPanamaPapua New GuineaParaguayPeruPhilippinesPolandPortugalPost-demographic dividendPre-demographic dividendQatarRomaniaRussian FederationRwandaSamoaSaudi ArabiaSenegalSerbiaSeychellesSierra LeoneSingaporeSlovak RepublicSloveniaSmall statesSolomon IslandsSomaliaSouth AfricaSouth AsiaSouth Asia (IDA & IBRD)SpainSri LankaSt. Kitts and NevisSt. LuciaSt. Vincent and the GrenadinesSub-Saharan Africa Sub-Saharan Africa (excluding high income)Sub-Saharan Africa (IDA & IBRD countries)SudanSurinameSwedenSwitzerlandSyrian Arab RepublicTajikistanTanzaniaThailandTogoTongaTrinidad and TobagoTunisiaTurkeyTurkmenistanUgandaUkraineUnited Arab EmiratesUnited KingdomUnited StatesUpper middle incomeUruguayUzbekistanVanuatuVenezuela, RBVietnamWorldYemen, Rep.ZambiaZimbabwe Timeline:
This timeline shows a graph from 1961 to 2015 of Europe & Central Asia (IDA & IBRD countries). No data until 1960. Number of actual observations by date: 55.
Source name:
World Development Indicators
Source organization:
World Bank staff estimates based data from International Monetary Fund's Direction of Trade database.
Categories, topics:
Private Sector, Trade
Last updated:
apr 23, 2017
Indicators value changes by year
At the date of observation
Value
Absolute change
Change from previous value
jan 1, 1961
1.12
+1.12
0.0%
jan 1, 1962
0.995
-0.125
-11.12%
jan 1, 1963
0.985
-0.01
-1.02%
jan 1, 1964
0.929
-0.056
-5.72%
jan 1, 1965
0.49
-0.439
-47.23%
jan 1, 1966
0.866
+0.375
76.61%
jan 1, 1967
0.689
-0.177
-20.43%
jan 1, 1968
0.633
-0.056
-8.08%
jan 1, 1969
0.57
-0.063
-9.9%
jan 1, 1970
0.653
+0.083
14.47%
jan 1, 1971
0.829
+0.176
27.02%
jan 1, 1972
0.722
-0.108
-12.96%
jan 1, 1973
0.811
+0.09
12.41%
jan 1, 1974
0.704
-0.107
-13.23%
jan 1, 1975
0.587
-0.117
-16.68%
jan 1, 1976
0.749
+0.162
27.66%
jan 1, 1977
0.825
+0.076
10.16%
jan 1, 1978
0.714
-0.111
-13.49%
jan 1, 1979
0.462
-0.252
-35.3%
jan 1, 1980
0.508
+0.046
9.99%
jan 1, 1981
0.452
-0.056
-11.04%
jan 1, 1982
0.639
+0.188
41.51%
jan 1, 1983
1.229
+0.59
92.29%
jan 1, 1984
0.687
-0.542
-44.1%
jan 1, 1985
0.829
+0.142
20.65%
jan 1, 1986
0.889
+0.06
7.2%
jan 1, 1987
0.901
+0.012
1.36%
jan 1, 1988
0.94
+0.039
4.38%
jan 1, 1989
0.817
-0.124
-13.17%
jan 1, 1990
0.693
-0.124
-15.16%
jan 1, 1991
0.862
+0.169
24.4%
jan 1, 1992
0.789
-0.073
-8.47%
jan 1, 1993
1.458
+0.669
84.85%
jan 1, 1994
1.915
+0.457
31.34%
jan 1, 1995
1.02
-0.896
-46.76%
jan 1, 1996
0.914
-0.106
-10.4%
jan 1, 1997
0.883
-0.031
-3.4%
jan 1, 1998
0.868
-0.015
-1.71%
jan 1, 1999
0.833
-0.034
-3.98%
jan 1, 2000
0.883
+0.05
6.05%
jan 1, 2001
0.825
-0.058
-6.6%
jan 1, 2002
0.848
+0.022
2.71%
jan 1, 2003
0.873
+0.025
3.0%
jan 1, 2004
0.85
-0.023
-2.65%
jan 1, 2005
0.872
+0.023
2.66%
jan 1, 2006
0.836
-0.036
-4.17%
jan 1, 2007
0.847
+0.011
1.26%
jan 1, 2008
0.875
+0.028
3.31%
jan 1, 2009
0.885
+0.01
1.15%
jan 1, 2010
1.129
+0.244
27.63%
jan 1, 2011
1.332
+0.203
17.97%
jan 1, 2012
1.476
+0.144
10.81%
jan 1, 2013
1.436
-0.04
-2.73%
jan 1, 2014
1.486
+0.05
3.51%
jan 1, 2015
1.606
+0.12
8.06%
Ranking of countries by current statistics by years


Comments: