29
/
en
AIzaSyAYiBZKx7MnpbEhh9jyipgxe19OcubqV5w
April 1, 2024
159677
Ireland
IRL
true
2
1
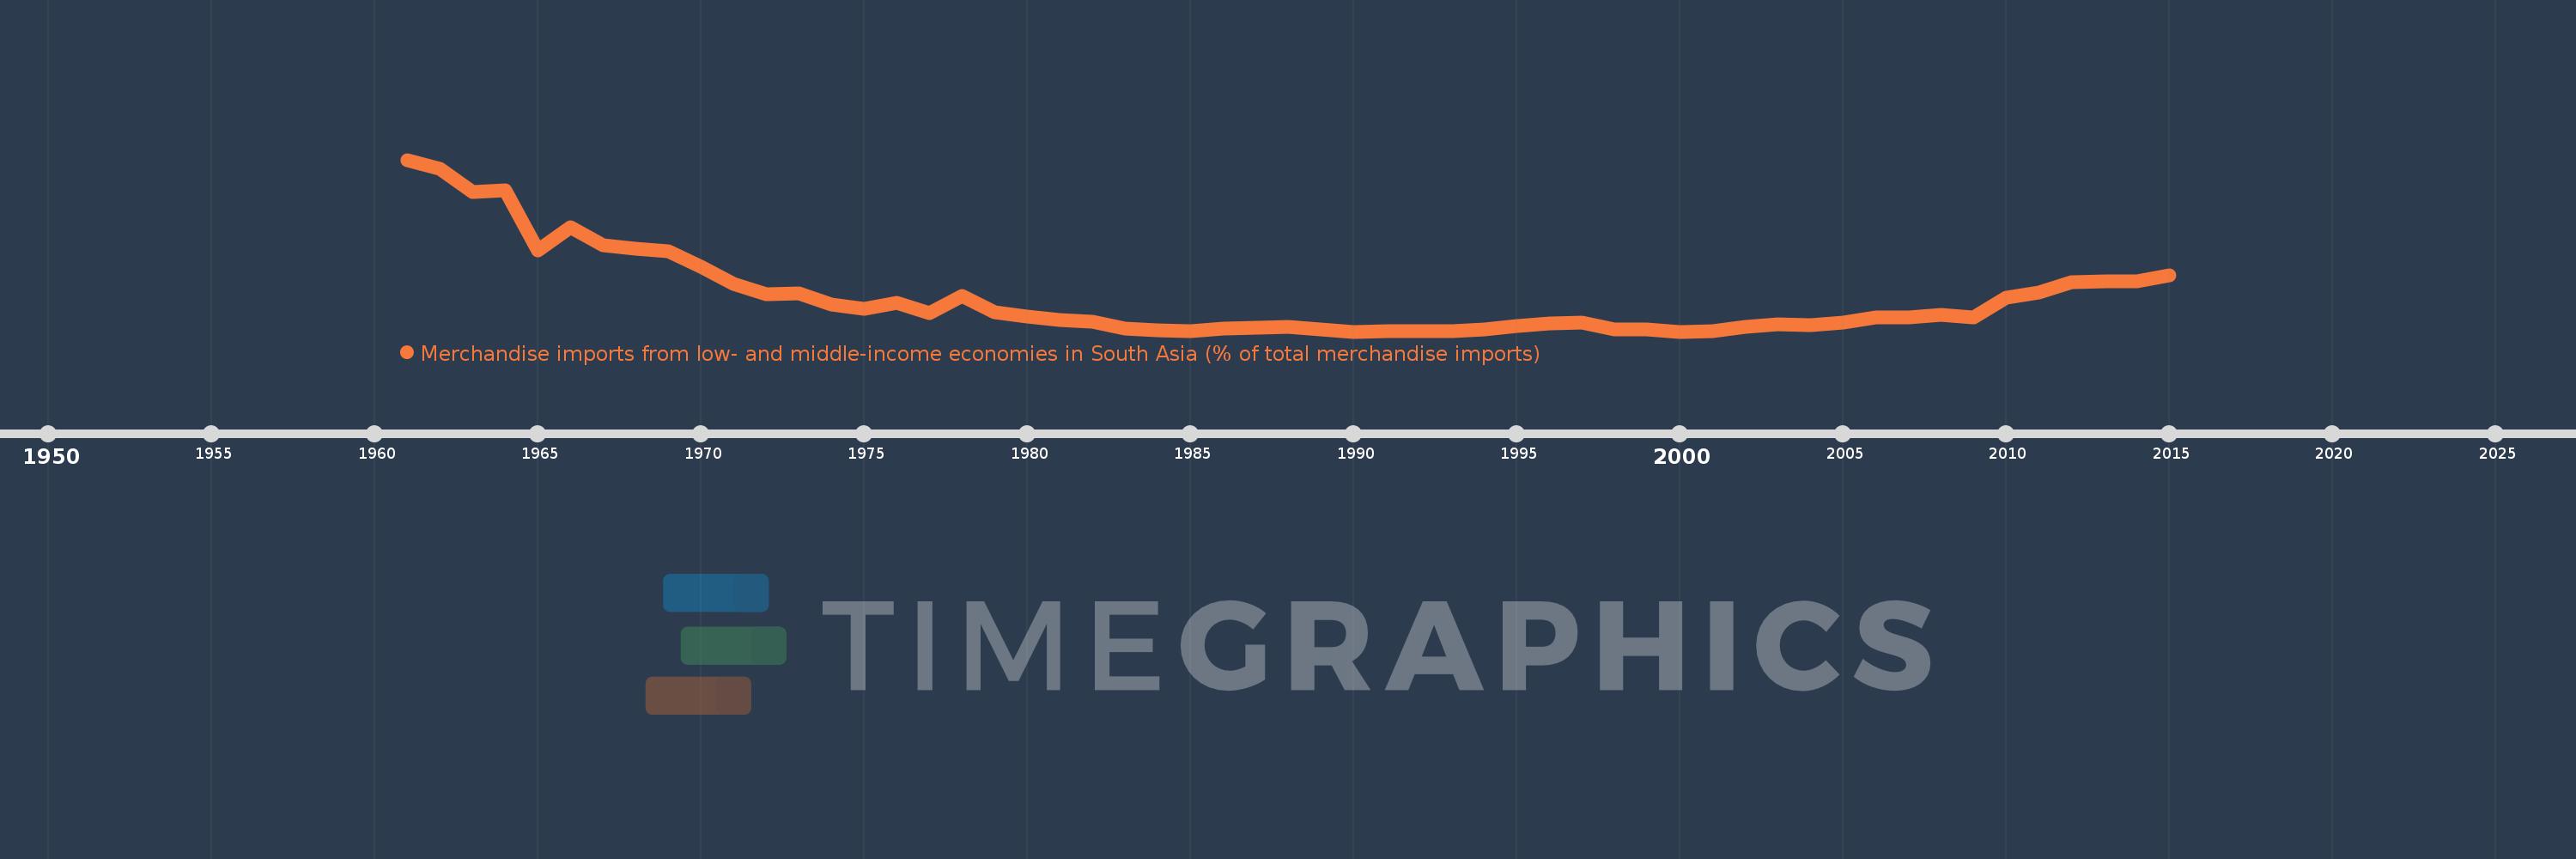
Merchandise imports from low- and middle-income economies in South Asia (% of total merchandise imports)
2015,2014,2013,2012,2011,2010,2009,2008,2007,2006,2005,2004,2003,2002,2001,2000,1999,1998,1997,1996,1995,1994,1993,1992,1991,1990,1989,1988,1987,1986,1985,1984,1983,1982,1981,1980,1979,1978,1977,1976,1975,1974,1973,1972,1971,1970,1969,1968,1967,1966,1965,1964,1963,1962,1961
This statistics in other country:
AfghanistanAlbaniaAlgeriaAngolaAntigua and BarbudaArab WorldArgentinaArmeniaArubaAustraliaAustriaAzerbaijanBahamas, TheBahrainBangladeshBarbadosBelarusBelgiumBelizeBeninBermudaBoliviaBrazilBrunei DarussalamBulgariaBurkina FasoBurundiCabo VerdeCambodiaCameroonCanadaCaribbean small statesCentral African RepublicCentral Europe and the BalticsChadChileChinaColombiaCongo, Dem. Rep.Congo, Rep.Costa RicaCote d'IvoireCroatiaCubaCyprusCzech RepublicDenmarkDjiboutiDominicaDominican RepublicEarly-demographic dividendEast Asia & PacificEast Asia & Pacific (excluding high income)East Asia & Pacific (IDA & IBRD countries)EcuadorEgypt, Arab Rep.El SalvadorEstoniaEthiopiaEuro areaEurope & Central AsiaEurope & Central Asia (excluding high income)Europe & Central Asia (IDA & IBRD countries)European UnionFaroe IslandsFijiFinlandFragile and conflict affected situationsFranceGabonGambia, TheGeorgiaGermanyGhanaGibraltarGreeceGreenlandGrenadaGuatemalaGuineaGuyanaHaitiHeavily indebted poor countries (HIPC)High incomeHondurasHong Kong SAR, ChinaHungaryIBRD onlyIcelandIDA & IBRD totalIDA blendIDA onlyIDA totalIndiaIndonesiaIran, Islamic Rep.IraqIrelandIsraelItalyJamaicaJapanJordanKazakhstanKenyaKiribatiKorea, Dem. People’s Rep.Korea, Rep.KosovoKuwaitKyrgyz RepublicLao PDRLate-demographic dividendLatin America & Caribbean Latin America & Caribbean (excluding high income)Latin America & the Caribbean (IDA & IBRD countries)LatviaLeast developed countries: UN classificationLebanonLiberiaLibyaLithuaniaLow & middle incomeLow incomeLower middle incomeLuxembourgMacao SAR, ChinaMacedonia, FYRMadagascarMalawiMalaysiaMaldivesMaliMaltaMauritaniaMauritiusMexicoMiddle East & North AfricaMiddle East & North Africa (excluding high income)Middle East & North Africa (IDA & IBRD countries)Middle incomeMoldovaMongoliaMontenegroMoroccoMozambiqueMyanmarNauruNepalNetherlandsNew CaledoniaNew ZealandNicaraguaNigerNigeriaNorth AmericaNorwayOECD membersOmanOther small statesPacific island small statesPakistanPanamaPapua New GuineaParaguayPeruPhilippinesPolandPortugalPost-demographic dividendPre-demographic dividendQatarRomaniaRussian FederationRwandaSamoaSaudi ArabiaSenegalSerbiaSeychellesSierra LeoneSingaporeSlovak RepublicSloveniaSmall statesSolomon IslandsSomaliaSouth AfricaSouth AsiaSouth Asia (IDA & IBRD)SpainSri LankaSt. Kitts and NevisSt. LuciaSt. Vincent and the GrenadinesSub-Saharan Africa Sub-Saharan Africa (excluding high income)Sub-Saharan Africa (IDA & IBRD countries)SudanSurinameSwedenSwitzerlandSyrian Arab RepublicTajikistanTanzaniaThailandTogoTongaTrinidad and TobagoTunisiaTurkeyTurkmenistanUgandaUkraineUnited Arab EmiratesUnited KingdomUnited StatesUpper middle incomeUruguayUzbekistanVanuatuVenezuela, RBVietnamWorldYemen, Rep.ZambiaZimbabwe Timeline:
This timeline shows a graph from 1961 to 2015 of Ireland. No data until 1960. Number of actual observations by date: 55.
Source name:
World Development Indicators
Source organization:
World Bank staff estimates based data from International Monetary Fund's Direction of Trade database.
Categories, topics:
Private Sector, Trade
Last updated:
apr 23, 2017
Indicators value changes by year
At the date of observation
Value
Absolute change
Change from previous value
jan 1, 1961
2.413
+2.413
0.0%
jan 1, 1962
2.305
-0.108
-4.47%
jan 1, 1963
2.017
-0.288
-12.5%
jan 1, 1964
2.042
+0.025
1.22%
jan 1, 1965
1.302
-0.739
-36.22%
jan 1, 1966
1.582
+0.28
21.5%
jan 1, 1967
1.363
-0.219
-13.82%
jan 1, 1968
1.325
-0.038
-2.79%
jan 1, 1969
1.295
-0.03
-2.27%
jan 1, 1970
1.107
-0.188
-14.53%
jan 1, 1971
0.892
-0.215
-19.46%
jan 1, 1972
0.762
-0.13
-14.55%
jan 1, 1973
0.771
+0.009
1.15%
jan 1, 1974
0.639
-0.131
-17.02%
jan 1, 1975
0.588
-0.051
-7.98%
jan 1, 1976
0.663
+0.074
12.64%
jan 1, 1977
0.537
-0.125
-18.9%
jan 1, 1978
0.743
+0.205
38.16%
jan 1, 1979
0.543
-0.2
-26.92%
jan 1, 1980
0.487
-0.056
-10.24%
jan 1, 1981
0.444
-0.043
-8.92%
jan 1, 1982
0.43
-0.014
-3.16%
jan 1, 1983
0.343
-0.086
-20.11%
jan 1, 1984
0.318
-0.026
-7.45%
jan 1, 1985
0.308
-0.01
-3.11%
jan 1, 1986
0.344
+0.036
11.63%
jan 1, 1987
0.352
+0.008
2.38%
jan 1, 1988
0.368
+0.016
4.62%
jan 1, 1989
0.334
-0.034
-9.13%
jan 1, 1990
0.307
-0.028
-8.27%
jan 1, 1991
0.316
+0.009
3.01%
jan 1, 1992
0.311
-0.005
-1.5%
jan 1, 1993
0.311
0.0
-0.01%
jan 1, 1994
0.33
+0.019
5.97%
jan 1, 1995
0.371
+0.041
12.37%
jan 1, 1996
0.404
+0.033
8.94%
jan 1, 1997
0.417
+0.013
3.17%
jan 1, 1998
0.335
-0.082
-19.57%
jan 1, 1999
0.336
+0.001
0.22%
jan 1, 2000
0.307
-0.029
-8.52%
jan 1, 2001
0.314
+0.007
2.3%
jan 1, 2002
0.361
+0.047
15.01%
jan 1, 2003
0.398
+0.036
10.09%
jan 1, 2004
0.387
-0.011
-2.74%
jan 1, 2005
0.422
+0.035
8.96%
jan 1, 2006
0.483
+0.062
14.6%
jan 1, 2007
0.485
+0.002
0.44%
jan 1, 2008
0.517
+0.032
6.58%
jan 1, 2009
0.476
-0.041
-7.93%
jan 1, 2010
0.719
+0.243
50.94%
jan 1, 2011
0.788
+0.069
9.65%
jan 1, 2012
0.912
+0.124
15.68%
jan 1, 2013
0.921
+0.009
0.99%
jan 1, 2014
0.926
+0.005
0.51%
jan 1, 2015
0.999
+0.073
7.91%
Ranking of countries by current statistics by years


Comments: