29
/
en
AIzaSyAYiBZKx7MnpbEhh9jyipgxe19OcubqV5w
April 1, 2024
213252
Nigeria
NGA
true
2
1
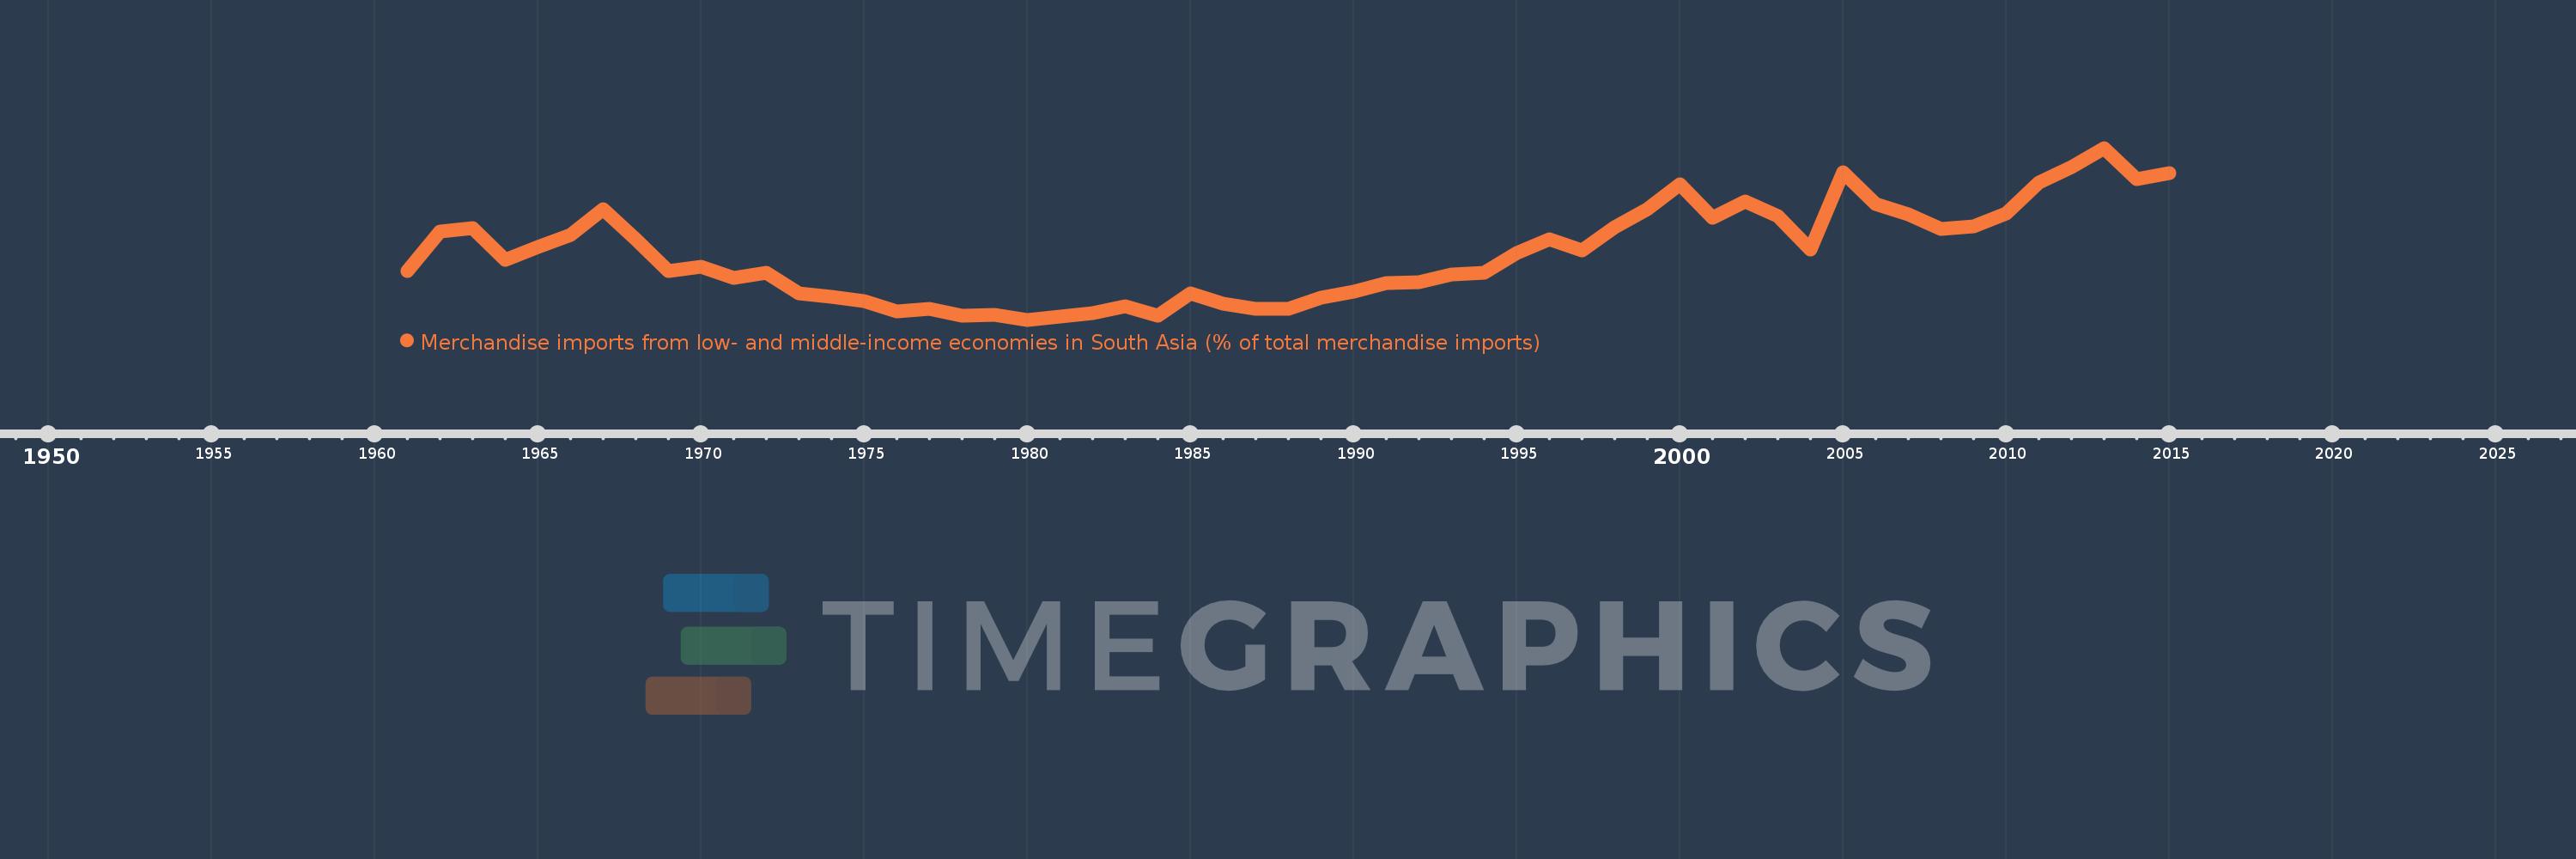
Merchandise imports from low- and middle-income economies in South Asia (% of total merchandise imports)
2015,2014,2013,2012,2011,2010,2009,2008,2007,2006,2005,2004,2003,2002,2001,2000,1999,1998,1997,1996,1995,1994,1993,1992,1991,1990,1989,1988,1987,1986,1985,1984,1983,1982,1980,1979,1978,1977,1976,1975,1974,1973,1972,1971,1970,1969,1968,1967,1966,1965,1964,1963,1962,1961
This statistics in other country:
AfghanistanAlbaniaAlgeriaAngolaAntigua and BarbudaArab WorldArgentinaArmeniaArubaAustraliaAustriaAzerbaijanBahamas, TheBahrainBangladeshBarbadosBelarusBelgiumBelizeBeninBermudaBoliviaBrazilBrunei DarussalamBulgariaBurkina FasoBurundiCabo VerdeCambodiaCameroonCanadaCaribbean small statesCentral African RepublicCentral Europe and the BalticsChadChileChinaColombiaCongo, Dem. Rep.Congo, Rep.Costa RicaCote d'IvoireCroatiaCubaCyprusCzech RepublicDenmarkDjiboutiDominicaDominican RepublicEarly-demographic dividendEast Asia & PacificEast Asia & Pacific (excluding high income)East Asia & Pacific (IDA & IBRD countries)EcuadorEgypt, Arab Rep.El SalvadorEstoniaEthiopiaEuro areaEurope & Central AsiaEurope & Central Asia (excluding high income)Europe & Central Asia (IDA & IBRD countries)European UnionFaroe IslandsFijiFinlandFragile and conflict affected situationsFranceGabonGambia, TheGeorgiaGermanyGhanaGibraltarGreeceGreenlandGrenadaGuatemalaGuineaGuyanaHaitiHeavily indebted poor countries (HIPC)High incomeHondurasHong Kong SAR, ChinaHungaryIBRD onlyIcelandIDA & IBRD totalIDA blendIDA onlyIDA totalIndiaIndonesiaIran, Islamic Rep.IraqIrelandIsraelItalyJamaicaJapanJordanKazakhstanKenyaKiribatiKorea, Dem. People’s Rep.Korea, Rep.KosovoKuwaitKyrgyz RepublicLao PDRLate-demographic dividendLatin America & Caribbean Latin America & Caribbean (excluding high income)Latin America & the Caribbean (IDA & IBRD countries)LatviaLeast developed countries: UN classificationLebanonLiberiaLibyaLithuaniaLow & middle incomeLow incomeLower middle incomeLuxembourgMacao SAR, ChinaMacedonia, FYRMadagascarMalawiMalaysiaMaldivesMaliMaltaMauritaniaMauritiusMexicoMiddle East & North AfricaMiddle East & North Africa (excluding high income)Middle East & North Africa (IDA & IBRD countries)Middle incomeMoldovaMongoliaMontenegroMoroccoMozambiqueMyanmarNauruNepalNetherlandsNew CaledoniaNew ZealandNicaraguaNigerNigeriaNorth AmericaNorwayOECD membersOmanOther small statesPacific island small statesPakistanPanamaPapua New GuineaParaguayPeruPhilippinesPolandPortugalPost-demographic dividendPre-demographic dividendQatarRomaniaRussian FederationRwandaSamoaSaudi ArabiaSenegalSerbiaSeychellesSierra LeoneSingaporeSlovak RepublicSloveniaSmall statesSolomon IslandsSomaliaSouth AfricaSouth AsiaSouth Asia (IDA & IBRD)SpainSri LankaSt. Kitts and NevisSt. LuciaSt. Vincent and the GrenadinesSub-Saharan Africa Sub-Saharan Africa (excluding high income)Sub-Saharan Africa (IDA & IBRD countries)SudanSurinameSwedenSwitzerlandSyrian Arab RepublicTajikistanTanzaniaThailandTogoTongaTrinidad and TobagoTunisiaTurkeyTurkmenistanUgandaUkraineUnited Arab EmiratesUnited KingdomUnited StatesUpper middle incomeUruguayUzbekistanVanuatuVenezuela, RBVietnamWorldYemen, Rep.ZambiaZimbabwe Timeline:
This timeline shows a graph from 1961 to 2015 of Nigeria. No data until 1960. Number of actual observations by date: 54.
Source name:
World Development Indicators
Source organization:
World Bank staff estimates based data from International Monetary Fund's Direction of Trade database.
Categories, topics:
Private Sector, Trade
Last updated:
apr 23, 2017
Indicators value changes by year
At the date of observation
Value
Absolute change
Change from previous value
jan 1, 1961
1.941
+1.941
0.0%
jan 1, 1962
3.119
+1.178
60.69%
jan 1, 1963
3.225
+0.106
3.39%
jan 1, 1964
2.258
-0.967
-29.98%
jan 1, 1965
2.658
+0.4
17.71%
jan 1, 1966
3.001
+0.343
12.9%
jan 1, 1967
3.776
+0.775
25.84%
jan 1, 1968
2.874
-0.903
-23.91%
jan 1, 1969
1.946
-0.928
-32.3%
jan 1, 1970
2.07
+0.125
6.41%
jan 1, 1971
1.729
-0.342
-16.5%
jan 1, 1972
1.874
+0.146
8.43%
jan 1, 1973
1.263
-0.612
-32.63%
jan 1, 1974
1.161
-0.102
-8.09%
jan 1, 1975
1.035
-0.126
-10.85%
jan 1, 1976
0.728
-0.307
-29.66%
jan 1, 1977
0.795
+0.067
9.24%
jan 1, 1978
0.604
-0.191
-23.99%
jan 1, 1979
0.631
+0.026
4.35%
jan 1, 1980
0.479
-0.152
-24.1%
jan 1, 1982
0.682
+0.203
42.49%
jan 1, 1983
0.871
+0.189
27.75%
jan 1, 1984
0.602
-0.269
-30.88%
jan 1, 1985
1.268
+0.666
110.6%
jan 1, 1986
0.948
-0.32
-25.23%
jan 1, 1987
0.808
-0.14
-14.76%
jan 1, 1988
0.808
+0.0
0.0%
jan 1, 1989
1.135
+0.326
40.39%
jan 1, 1990
1.327
+0.192
16.88%
jan 1, 1991
1.568
+0.241
18.2%
jan 1, 1992
1.594
+0.026
1.67%
jan 1, 1993
1.832
+0.237
14.88%
jan 1, 1994
1.887
+0.056
3.04%
jan 1, 1995
2.461
+0.574
30.4%
jan 1, 1996
2.877
+0.416
16.91%
jan 1, 1997
2.539
-0.338
-11.74%
jan 1, 1998
3.246
+0.707
27.85%
jan 1, 1999
3.774
+0.528
16.26%
jan 1, 2000
4.513
+0.739
19.58%
jan 1, 2001
3.526
-0.987
-21.87%
jan 1, 2002
4.024
+0.497
14.1%
jan 1, 2003
3.584
-0.44
-10.93%
jan 1, 2004
2.565
-1.018
-28.41%
jan 1, 2005
4.875
+2.31
90.04%
jan 1, 2006
3.937
-0.939
-19.25%
jan 1, 2007
3.633
-0.303
-7.71%
jan 1, 2008
3.182
-0.451
-12.42%
jan 1, 2009
3.267
+0.086
2.69%
jan 1, 2010
3.647
+0.38
11.62%
jan 1, 2011
4.574
+0.927
25.42%
jan 1, 2012
5.03
+0.456
9.97%
jan 1, 2013
5.611
+0.581
11.54%
jan 1, 2014
4.686
-0.924
-16.47%
jan 1, 2015
4.869
+0.183
3.9%
Ranking of countries by current statistics by years


Comments: