29
/
en
AIzaSyAYiBZKx7MnpbEhh9jyipgxe19OcubqV5w
April 1, 2024
211988
Niger
NER
true
2
1
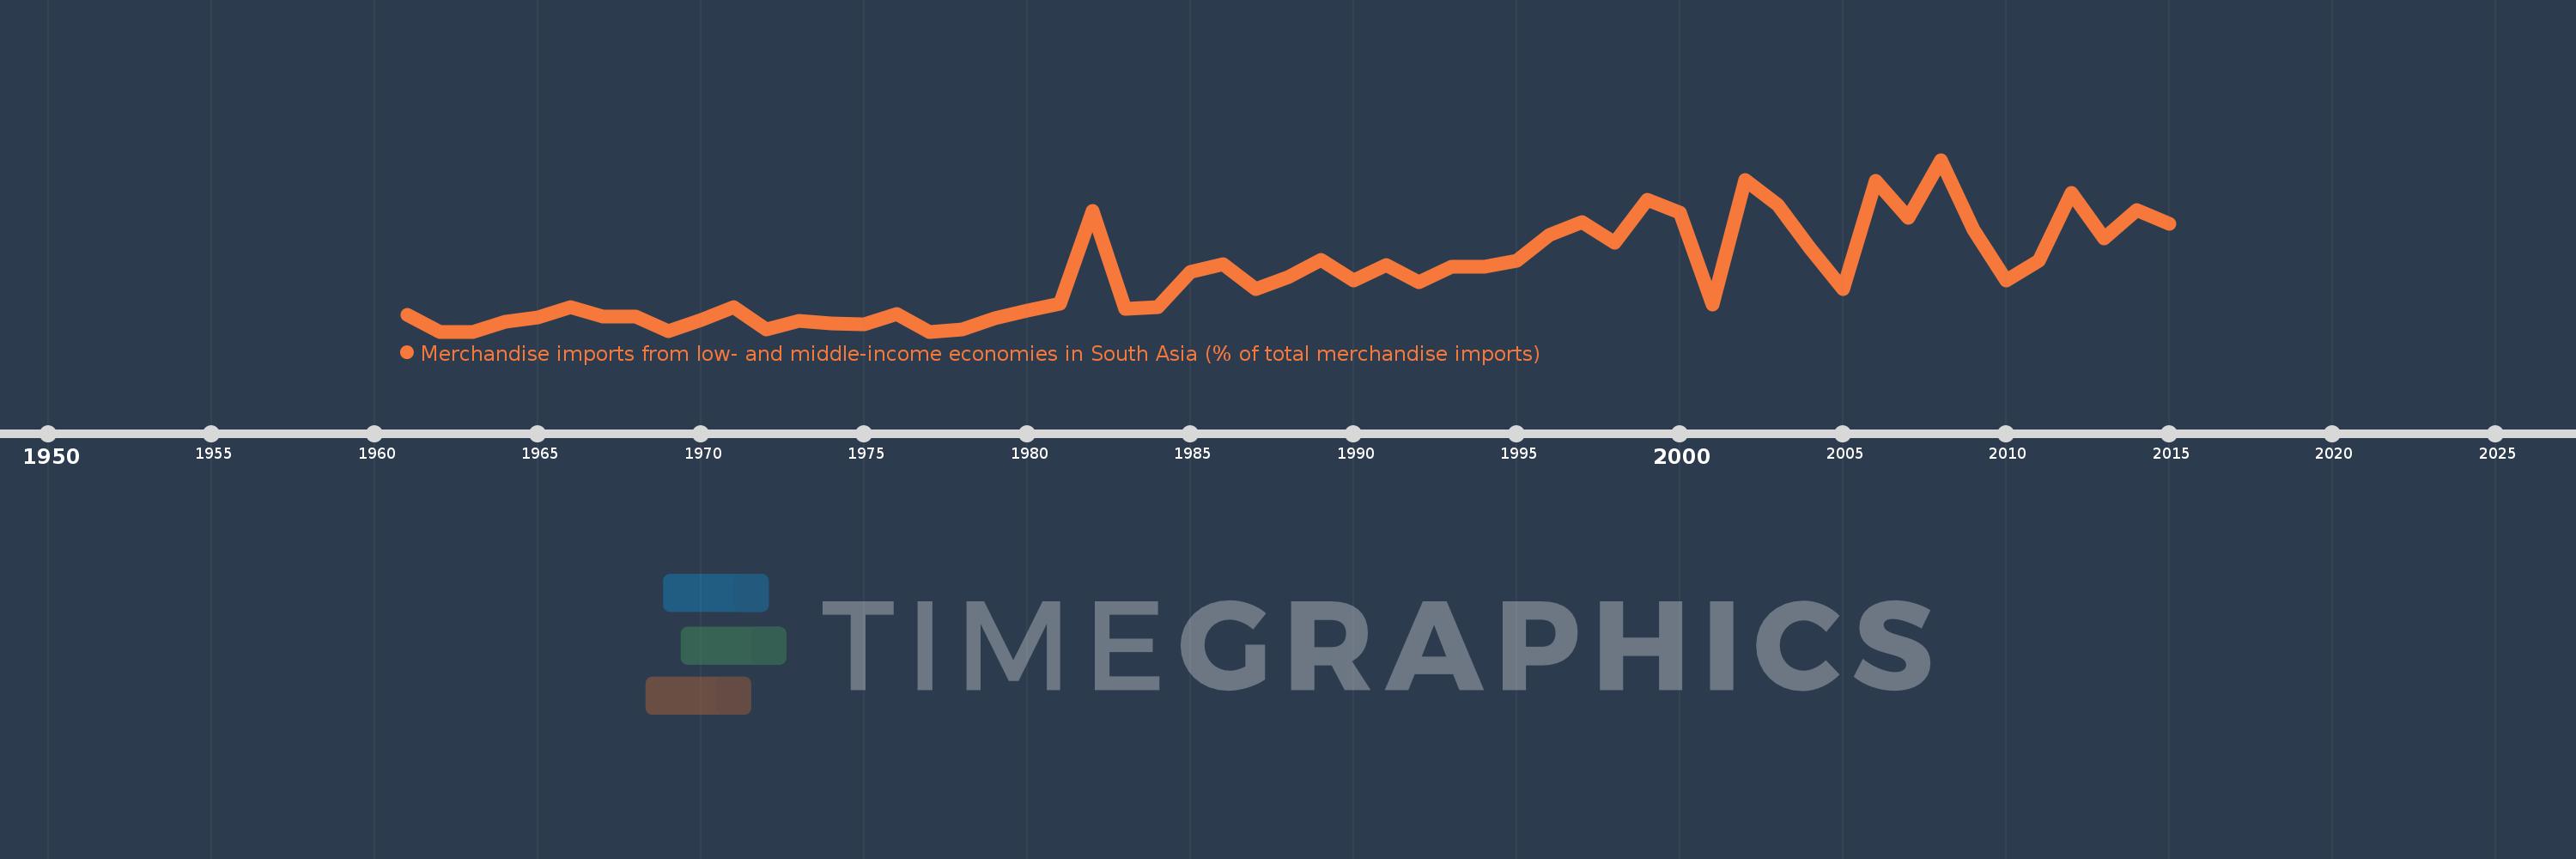
Merchandise imports from low- and middle-income economies in South Asia (% of total merchandise imports)
2015,2014,2013,2012,2011,2010,2009,2008,2007,2006,2005,2004,2003,2002,2001,2000,1999,1998,1997,1996,1995,1994,1993,1992,1991,1990,1989,1988,1987,1986,1985,1984,1983,1982,1981,1980,1979,1978,1977,1976,1975,1974,1973,1972,1971,1970,1969,1968,1967,1966,1965,1964,1963,1962,1961
This statistics in other country:
AfghanistanAlbaniaAlgeriaAngolaAntigua and BarbudaArab WorldArgentinaArmeniaArubaAustraliaAustriaAzerbaijanBahamas, TheBahrainBangladeshBarbadosBelarusBelgiumBelizeBeninBermudaBoliviaBrazilBrunei DarussalamBulgariaBurkina FasoBurundiCabo VerdeCambodiaCameroonCanadaCaribbean small statesCentral African RepublicCentral Europe and the BalticsChadChileChinaColombiaCongo, Dem. Rep.Congo, Rep.Costa RicaCote d'IvoireCroatiaCubaCyprusCzech RepublicDenmarkDjiboutiDominicaDominican RepublicEarly-demographic dividendEast Asia & PacificEast Asia & Pacific (excluding high income)East Asia & Pacific (IDA & IBRD countries)EcuadorEgypt, Arab Rep.El SalvadorEstoniaEthiopiaEuro areaEurope & Central AsiaEurope & Central Asia (excluding high income)Europe & Central Asia (IDA & IBRD countries)European UnionFaroe IslandsFijiFinlandFragile and conflict affected situationsFranceGabonGambia, TheGeorgiaGermanyGhanaGibraltarGreeceGreenlandGrenadaGuatemalaGuineaGuyanaHaitiHeavily indebted poor countries (HIPC)High incomeHondurasHong Kong SAR, ChinaHungaryIBRD onlyIcelandIDA & IBRD totalIDA blendIDA onlyIDA totalIndiaIndonesiaIran, Islamic Rep.IraqIrelandIsraelItalyJamaicaJapanJordanKazakhstanKenyaKiribatiKorea, Dem. People’s Rep.Korea, Rep.KosovoKuwaitKyrgyz RepublicLao PDRLate-demographic dividendLatin America & Caribbean Latin America & Caribbean (excluding high income)Latin America & the Caribbean (IDA & IBRD countries)LatviaLeast developed countries: UN classificationLebanonLiberiaLibyaLithuaniaLow & middle incomeLow incomeLower middle incomeLuxembourgMacao SAR, ChinaMacedonia, FYRMadagascarMalawiMalaysiaMaldivesMaliMaltaMauritaniaMauritiusMexicoMiddle East & North AfricaMiddle East & North Africa (excluding high income)Middle East & North Africa (IDA & IBRD countries)Middle incomeMoldovaMongoliaMontenegroMoroccoMozambiqueMyanmarNauruNepalNetherlandsNew CaledoniaNew ZealandNicaraguaNigerNigeriaNorth AmericaNorwayOECD membersOmanOther small statesPacific island small statesPakistanPanamaPapua New GuineaParaguayPeruPhilippinesPolandPortugalPost-demographic dividendPre-demographic dividendQatarRomaniaRussian FederationRwandaSamoaSaudi ArabiaSenegalSerbiaSeychellesSierra LeoneSingaporeSlovak RepublicSloveniaSmall statesSolomon IslandsSomaliaSouth AfricaSouth AsiaSouth Asia (IDA & IBRD)SpainSri LankaSt. Kitts and NevisSt. LuciaSt. Vincent and the GrenadinesSub-Saharan Africa Sub-Saharan Africa (excluding high income)Sub-Saharan Africa (IDA & IBRD countries)SudanSurinameSwedenSwitzerlandSyrian Arab RepublicTajikistanTanzaniaThailandTogoTongaTrinidad and TobagoTunisiaTurkeyTurkmenistanUgandaUkraineUnited Arab EmiratesUnited KingdomUnited StatesUpper middle incomeUruguayUzbekistanVanuatuVenezuela, RBVietnamWorldYemen, Rep.ZambiaZimbabwe Timeline:
This timeline shows a graph from 1961 to 2015 of Niger. No data until 1960. Number of actual observations by date: 55.
Source name:
World Development Indicators
Source organization:
World Bank staff estimates based data from International Monetary Fund's Direction of Trade database.
Categories, topics:
Private Sector, Trade
Last updated:
apr 23, 2017
Indicators value changes by year
At the date of observation
Value
Absolute change
Change from previous value
jan 1, 1961
0.735
+0.735
0.0%
jan 1, 1962
0.0
-0.735
-100.0%
jan 1, 1964
0.444
+0.444
%
jan 1, 1965
0.615
+0.171
38.46%
jan 1, 1966
1.075
+0.46
74.73%
jan 1, 1967
0.667
-0.409
-38.0%
jan 1, 1968
0.659
-0.007
-1.1%
jan 1, 1969
0.028
-0.632
-95.81%
jan 1, 1970
0.496
+0.468
1.69K%
jan 1, 1971
1.093
+0.597
120.52%
jan 1, 1972
0.082
-1.011
-92.53%
jan 1, 1973
0.474
+0.392
480.65%
jan 1, 1974
0.352
-0.122
-25.66%
jan 1, 1975
0.317
-0.036
-10.15%
jan 1, 1976
0.79
+0.474
149.59%
jan 1, 1977
0.0
-0.79
-100.0%
jan 1, 1979
0.572
+0.472
471.42%
jan 1, 1980
0.935
+0.363
63.53%
jan 1, 1981
1.253
+0.318
34.01%
jan 1, 1982
5.335
+4.082
325.76%
jan 1, 1983
1.01
-4.325
-81.07%
jan 1, 1984
1.071
+0.062
6.1%
jan 1, 1985
2.653
+1.582
147.62%
jan 1, 1986
3.004
+0.351
13.23%
jan 1, 1987
1.889
-1.115
-37.13%
jan 1, 1988
2.432
+0.543
28.77%
jan 1, 1989
3.181
+0.749
30.79%
jan 1, 1990
2.281
-0.9
-28.28%
jan 1, 1991
2.962
+0.681
29.84%
jan 1, 1992
2.197
-0.765
-25.83%
jan 1, 1993
2.867
+0.67
30.52%
jan 1, 1994
2.874
+0.007
0.25%
jan 1, 1995
3.133
+0.258
8.98%
jan 1, 1996
4.299
+1.166
37.23%
jan 1, 1997
4.873
+0.574
13.35%
jan 1, 1998
3.95
-0.922
-18.93%
jan 1, 1999
5.85
+1.9
48.1%
jan 1, 2000
5.272
-0.579
-9.89%
jan 1, 2001
1.189
-4.083
-77.45%
jan 1, 2002
6.722
+5.533
465.41%
jan 1, 2003
5.629
-1.093
-16.26%
jan 1, 2004
3.667
-1.962
-34.86%
jan 1, 2005
1.896
-1.772
-48.31%
jan 1, 2006
6.689
+4.793
252.86%
jan 1, 2007
5.054
-1.635
-24.44%
jan 1, 2008
7.619
+2.565
50.74%
jan 1, 2009
4.532
-3.087
-40.51%
jan 1, 2010
2.263
-2.269
-50.06%
jan 1, 2011
3.124
+0.861
38.04%
jan 1, 2012
6.155
+3.031
97.02%
jan 1, 2013
4.147
-2.008
-32.63%
jan 1, 2014
5.379
+1.232
29.72%
jan 1, 2015
4.795
-0.584
-10.85%
Ranking of countries by current statistics by years


Comments: