29
/
en
AIzaSyAYiBZKx7MnpbEhh9jyipgxe19OcubqV5w
April 1, 2024
170213
Korea, Rep.
KOR
true
2
1
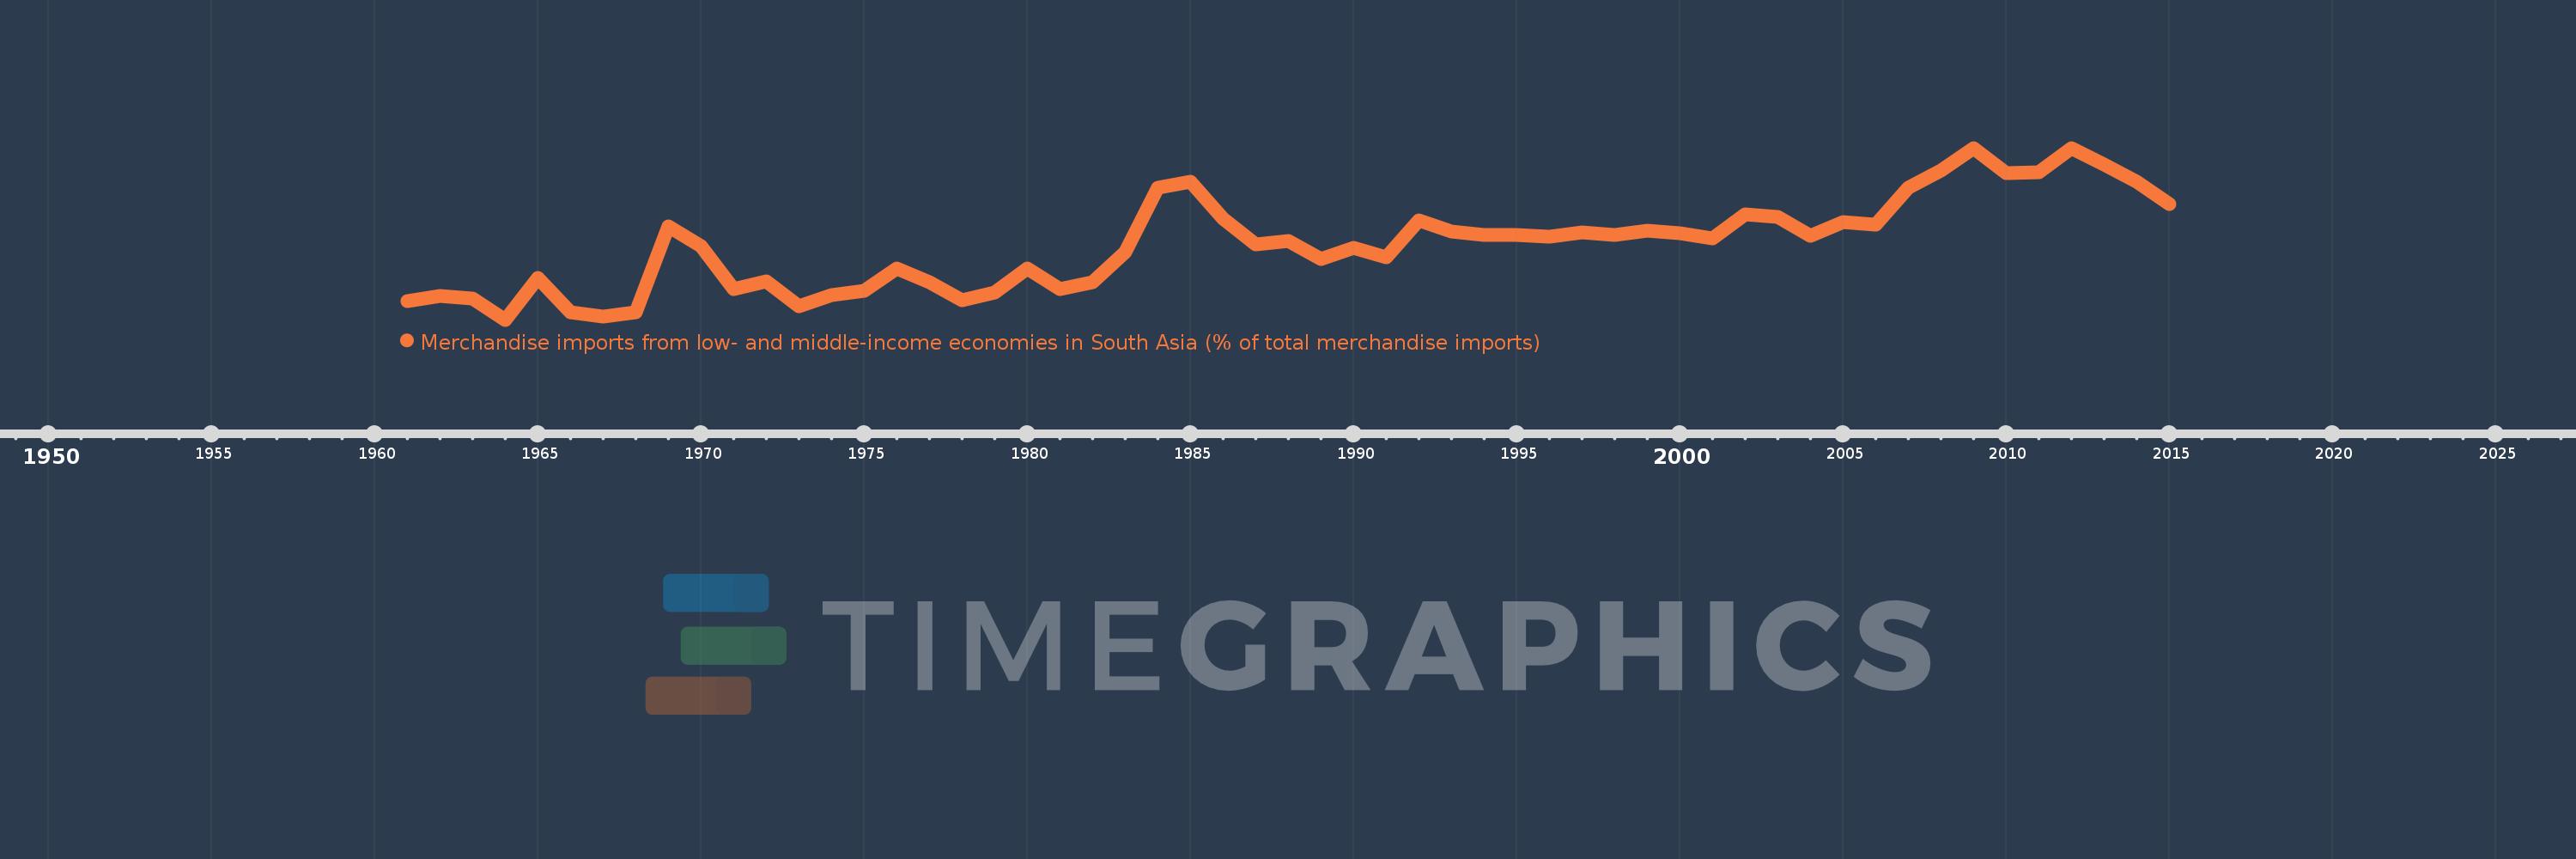
Merchandise imports from low- and middle-income economies in South Asia (% of total merchandise imports)
2015,2014,2013,2012,2011,2010,2009,2008,2007,2006,2005,2004,2003,2002,2001,2000,1999,1998,1997,1996,1995,1994,1993,1992,1991,1990,1989,1988,1987,1986,1985,1984,1983,1982,1981,1980,1979,1978,1977,1976,1975,1974,1973,1972,1971,1970,1969,1968,1967,1966,1965,1964,1963,1962,1961
This statistics in other country:
AfghanistanAlbaniaAlgeriaAngolaAntigua and BarbudaArab WorldArgentinaArmeniaArubaAustraliaAustriaAzerbaijanBahamas, TheBahrainBangladeshBarbadosBelarusBelgiumBelizeBeninBermudaBoliviaBrazilBrunei DarussalamBulgariaBurkina FasoBurundiCabo VerdeCambodiaCameroonCanadaCaribbean small statesCentral African RepublicCentral Europe and the BalticsChadChileChinaColombiaCongo, Dem. Rep.Congo, Rep.Costa RicaCote d'IvoireCroatiaCubaCyprusCzech RepublicDenmarkDjiboutiDominicaDominican RepublicEarly-demographic dividendEast Asia & PacificEast Asia & Pacific (excluding high income)East Asia & Pacific (IDA & IBRD countries)EcuadorEgypt, Arab Rep.El SalvadorEstoniaEthiopiaEuro areaEurope & Central AsiaEurope & Central Asia (excluding high income)Europe & Central Asia (IDA & IBRD countries)European UnionFaroe IslandsFijiFinlandFragile and conflict affected situationsFranceGabonGambia, TheGeorgiaGermanyGhanaGibraltarGreeceGreenlandGrenadaGuatemalaGuineaGuyanaHaitiHeavily indebted poor countries (HIPC)High incomeHondurasHong Kong SAR, ChinaHungaryIBRD onlyIcelandIDA & IBRD totalIDA blendIDA onlyIDA totalIndiaIndonesiaIran, Islamic Rep.IraqIrelandIsraelItalyJamaicaJapanJordanKazakhstanKenyaKiribatiKorea, Dem. People’s Rep.Korea, Rep.KosovoKuwaitKyrgyz RepublicLao PDRLate-demographic dividendLatin America & Caribbean Latin America & Caribbean (excluding high income)Latin America & the Caribbean (IDA & IBRD countries)LatviaLeast developed countries: UN classificationLebanonLiberiaLibyaLithuaniaLow & middle incomeLow incomeLower middle incomeLuxembourgMacao SAR, ChinaMacedonia, FYRMadagascarMalawiMalaysiaMaldivesMaliMaltaMauritaniaMauritiusMexicoMiddle East & North AfricaMiddle East & North Africa (excluding high income)Middle East & North Africa (IDA & IBRD countries)Middle incomeMoldovaMongoliaMontenegroMoroccoMozambiqueMyanmarNauruNepalNetherlandsNew CaledoniaNew ZealandNicaraguaNigerNigeriaNorth AmericaNorwayOECD membersOmanOther small statesPacific island small statesPakistanPanamaPapua New GuineaParaguayPeruPhilippinesPolandPortugalPost-demographic dividendPre-demographic dividendQatarRomaniaRussian FederationRwandaSamoaSaudi ArabiaSenegalSerbiaSeychellesSierra LeoneSingaporeSlovak RepublicSloveniaSmall statesSolomon IslandsSomaliaSouth AfricaSouth AsiaSouth Asia (IDA & IBRD)SpainSri LankaSt. Kitts and NevisSt. LuciaSt. Vincent and the GrenadinesSub-Saharan Africa Sub-Saharan Africa (excluding high income)Sub-Saharan Africa (IDA & IBRD countries)SudanSurinameSwedenSwitzerlandSyrian Arab RepublicTajikistanTanzaniaThailandTogoTongaTrinidad and TobagoTunisiaTurkeyTurkmenistanUgandaUkraineUnited Arab EmiratesUnited KingdomUnited StatesUpper middle incomeUruguayUzbekistanVanuatuVenezuela, RBVietnamWorldYemen, Rep.ZambiaZimbabwe Timeline:
This timeline shows a graph from 1961 to 2015 of Korea, Rep.. No data until 1960. Number of actual observations by date: 55.
Source name:
World Development Indicators
Source organization:
World Bank staff estimates based data from International Monetary Fund's Direction of Trade database.
Categories, topics:
Private Sector, Trade
Last updated:
apr 23, 2017
Indicators value changes by year
At the date of observation
Value
Absolute change
Change from previous value
jan 1, 1961
0.215
+0.215
0.0%
jan 1, 1962
0.269
+0.054
25.17%
jan 1, 1963
0.24
-0.029
-10.7%
jan 1, 1964
0.036
-0.204
-85.13%
jan 1, 1965
0.446
+0.41
1.15K%
jan 1, 1966
0.11
-0.336
-75.32%
jan 1, 1967
0.07
-0.04
-36.57%
jan 1, 1968
0.11
+0.041
58.26%
jan 1, 1969
0.947
+0.836
757.26%
jan 1, 1970
0.751
-0.196
-20.65%
jan 1, 1971
0.332
-0.419
-55.75%
jan 1, 1972
0.409
+0.077
23.13%
jan 1, 1973
0.17
-0.239
-58.35%
jan 1, 1974
0.278
+0.108
63.17%
jan 1, 1975
0.322
+0.044
15.81%
jan 1, 1976
0.536
+0.214
66.28%
jan 1, 1977
0.398
-0.138
-25.71%
jan 1, 1978
0.223
-0.175
-43.96%
jan 1, 1979
0.298
+0.075
33.84%
jan 1, 1980
0.538
+0.239
80.16%
jan 1, 1981
0.331
-0.206
-38.39%
jan 1, 1982
0.399
+0.068
20.48%
jan 1, 1983
0.692
+0.292
73.24%
jan 1, 1984
1.32
+0.628
90.83%
jan 1, 1985
1.382
+0.062
4.73%
jan 1, 1986
1.021
-0.361
-26.15%
jan 1, 1987
0.767
-0.253
-24.82%
jan 1, 1988
0.805
+0.038
4.89%
jan 1, 1989
0.631
-0.174
-21.58%
jan 1, 1990
0.737
+0.106
16.74%
jan 1, 1991
0.648
-0.088
-12.0%
jan 1, 1992
1.006
+0.358
55.17%
jan 1, 1993
0.893
-0.113
-11.28%
jan 1, 1994
0.864
-0.028
-3.16%
jan 1, 1995
0.864
0.0
-0.03%
jan 1, 1996
0.846
-0.019
-2.15%
jan 1, 1997
0.887
+0.042
4.91%
jan 1, 1998
0.865
-0.023
-2.54%
jan 1, 1999
0.9
+0.035
4.06%
jan 1, 2000
0.88
-0.02
-2.19%
jan 1, 2001
0.83
-0.05
-5.71%
jan 1, 2002
1.06
+0.231
27.81%
jan 1, 2003
1.038
-0.023
-2.16%
jan 1, 2004
0.853
-0.185
-17.78%
jan 1, 2005
0.988
+0.135
15.85%
jan 1, 2006
0.962
-0.027
-2.68%
jan 1, 2007
1.322
+0.36
37.49%
jan 1, 2008
1.487
+0.165
12.45%
jan 1, 2009
1.71
+0.223
15.01%
jan 1, 2010
1.461
-0.249
-14.55%
jan 1, 2011
1.475
+0.014
0.95%
jan 1, 2012
1.709
+0.233
15.82%
jan 1, 2013
1.552
-0.156
-9.14%
jan 1, 2014
1.381
-0.171
-11.02%
jan 1, 2015
1.165
-0.217
-15.69%
Ranking of countries by current statistics by years


Comments: