29
/
en
AIzaSyAYiBZKx7MnpbEhh9jyipgxe19OcubqV5w
April 1, 2024
142081
Greece
GRC
true
2
1
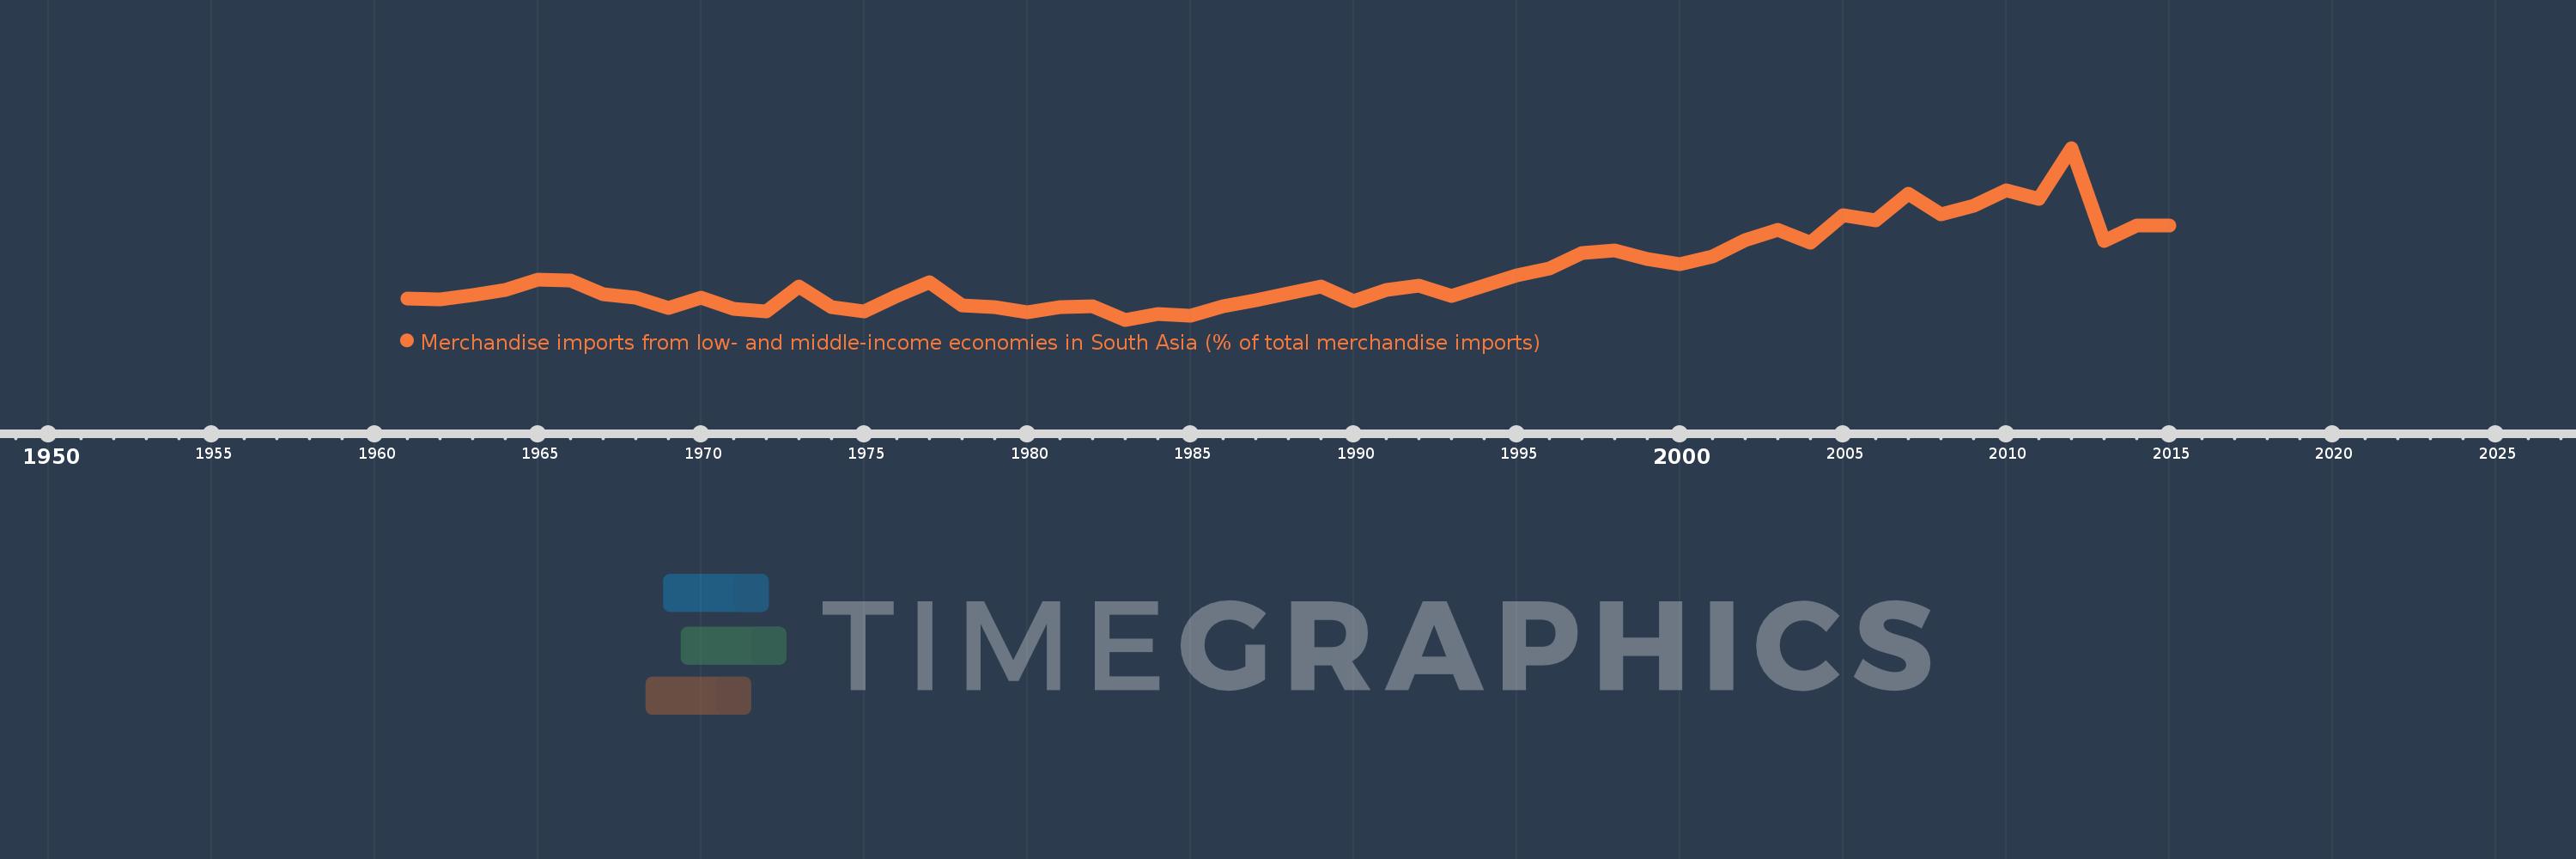
Merchandise imports from low- and middle-income economies in South Asia (% of total merchandise imports)
2015,2014,2013,2012,2011,2010,2009,2008,2007,2006,2005,2004,2003,2002,2001,2000,1999,1998,1997,1996,1995,1994,1993,1992,1991,1990,1989,1988,1987,1986,1985,1984,1983,1982,1981,1980,1979,1978,1977,1976,1975,1974,1973,1972,1971,1970,1969,1968,1967,1966,1965,1964,1963,1962,1961
This statistics in other country:
AfghanistanAlbaniaAlgeriaAngolaAntigua and BarbudaArab WorldArgentinaArmeniaArubaAustraliaAustriaAzerbaijanBahamas, TheBahrainBangladeshBarbadosBelarusBelgiumBelizeBeninBermudaBoliviaBrazilBrunei DarussalamBulgariaBurkina FasoBurundiCabo VerdeCambodiaCameroonCanadaCaribbean small statesCentral African RepublicCentral Europe and the BalticsChadChileChinaColombiaCongo, Dem. Rep.Congo, Rep.Costa RicaCote d'IvoireCroatiaCubaCyprusCzech RepublicDenmarkDjiboutiDominicaDominican RepublicEarly-demographic dividendEast Asia & PacificEast Asia & Pacific (excluding high income)East Asia & Pacific (IDA & IBRD countries)EcuadorEgypt, Arab Rep.El SalvadorEstoniaEthiopiaEuro areaEurope & Central AsiaEurope & Central Asia (excluding high income)Europe & Central Asia (IDA & IBRD countries)European UnionFaroe IslandsFijiFinlandFragile and conflict affected situationsFranceGabonGambia, TheGeorgiaGermanyGhanaGibraltarGreeceGreenlandGrenadaGuatemalaGuineaGuyanaHaitiHeavily indebted poor countries (HIPC)High incomeHondurasHong Kong SAR, ChinaHungaryIBRD onlyIcelandIDA & IBRD totalIDA blendIDA onlyIDA totalIndiaIndonesiaIran, Islamic Rep.IraqIrelandIsraelItalyJamaicaJapanJordanKazakhstanKenyaKiribatiKorea, Dem. People’s Rep.Korea, Rep.KosovoKuwaitKyrgyz RepublicLao PDRLate-demographic dividendLatin America & Caribbean Latin America & Caribbean (excluding high income)Latin America & the Caribbean (IDA & IBRD countries)LatviaLeast developed countries: UN classificationLebanonLiberiaLibyaLithuaniaLow & middle incomeLow incomeLower middle incomeLuxembourgMacao SAR, ChinaMacedonia, FYRMadagascarMalawiMalaysiaMaldivesMaliMaltaMauritaniaMauritiusMexicoMiddle East & North AfricaMiddle East & North Africa (excluding high income)Middle East & North Africa (IDA & IBRD countries)Middle incomeMoldovaMongoliaMontenegroMoroccoMozambiqueMyanmarNauruNepalNetherlandsNew CaledoniaNew ZealandNicaraguaNigerNigeriaNorth AmericaNorwayOECD membersOmanOther small statesPacific island small statesPakistanPanamaPapua New GuineaParaguayPeruPhilippinesPolandPortugalPost-demographic dividendPre-demographic dividendQatarRomaniaRussian FederationRwandaSamoaSaudi ArabiaSenegalSerbiaSeychellesSierra LeoneSingaporeSlovak RepublicSloveniaSmall statesSolomon IslandsSomaliaSouth AfricaSouth AsiaSouth Asia (IDA & IBRD)SpainSri LankaSt. Kitts and NevisSt. LuciaSt. Vincent and the GrenadinesSub-Saharan Africa Sub-Saharan Africa (excluding high income)Sub-Saharan Africa (IDA & IBRD countries)SudanSurinameSwedenSwitzerlandSyrian Arab RepublicTajikistanTanzaniaThailandTogoTongaTrinidad and TobagoTunisiaTurkeyTurkmenistanUgandaUkraineUnited Arab EmiratesUnited KingdomUnited StatesUpper middle incomeUruguayUzbekistanVanuatuVenezuela, RBVietnamWorldYemen, Rep.ZambiaZimbabwe Timeline:
This timeline shows a graph from 1961 to 2015 of Greece. No data until 1960. Number of actual observations by date: 55.
Source name:
World Development Indicators
Source organization:
World Bank staff estimates based data from International Monetary Fund's Direction of Trade database.
Categories, topics:
Private Sector, Trade
Last updated:
apr 23, 2017
Indicators value changes by year
At the date of observation
Value
Absolute change
Change from previous value
jan 1, 1961
0.272
+0.272
0.0%
jan 1, 1962
0.267
-0.005
-1.72%
jan 1, 1963
0.302
+0.034
12.76%
jan 1, 1964
0.338
+0.037
12.16%
jan 1, 1965
0.419
+0.081
23.99%
jan 1, 1966
0.414
-0.005
-1.16%
jan 1, 1967
0.305
-0.11
-26.48%
jan 1, 1968
0.278
-0.026
-8.67%
jan 1, 1969
0.205
-0.074
-26.46%
jan 1, 1970
0.28
+0.075
36.69%
jan 1, 1971
0.193
-0.087
-31.0%
jan 1, 1972
0.173
-0.02
-10.37%
jan 1, 1973
0.366
+0.193
111.7%
jan 1, 1974
0.211
-0.155
-42.35%
jan 1, 1975
0.173
-0.038
-18.0%
jan 1, 1976
0.294
+0.121
69.77%
jan 1, 1977
0.402
+0.108
36.74%
jan 1, 1978
0.219
-0.183
-45.43%
jan 1, 1979
0.207
-0.012
-5.46%
jan 1, 1980
0.166
-0.041
-19.96%
jan 1, 1981
0.206
+0.04
24.28%
jan 1, 1982
0.214
+0.008
3.96%
jan 1, 1983
0.112
-0.102
-47.67%
jan 1, 1984
0.155
+0.043
38.17%
jan 1, 1985
0.14
-0.015
-9.89%
jan 1, 1986
0.218
+0.078
55.96%
jan 1, 1987
0.259
+0.041
18.79%
jan 1, 1988
0.314
+0.055
21.35%
jan 1, 1989
0.365
+0.051
16.17%
jan 1, 1990
0.255
-0.11
-30.21%
jan 1, 1991
0.337
+0.083
32.48%
jan 1, 1992
0.376
+0.039
11.52%
jan 1, 1993
0.295
-0.081
-21.52%
jan 1, 1994
0.371
+0.075
25.53%
jan 1, 1995
0.451
+0.08
21.66%
jan 1, 1996
0.502
+0.051
11.4%
jan 1, 1997
0.623
+0.12
23.98%
jan 1, 1998
0.644
+0.021
3.38%
jan 1, 1999
0.576
-0.068
-10.49%
jan 1, 2000
0.536
-0.041
-7.05%
jan 1, 2001
0.595
+0.06
11.15%
jan 1, 2002
0.724
+0.128
21.53%
jan 1, 2003
0.799
+0.075
10.42%
jan 1, 2004
0.703
-0.095
-11.95%
jan 1, 2005
0.913
+0.209
29.77%
jan 1, 2006
0.871
-0.041
-4.53%
jan 1, 2007
1.079
+0.207
23.78%
jan 1, 2008
0.922
-0.157
-14.57%
jan 1, 2009
0.982
+0.06
6.53%
jan 1, 2010
1.104
+0.123
12.5%
jan 1, 2011
1.038
-0.067
-6.02%
jan 1, 2012
1.427
+0.389
37.44%
jan 1, 2013
0.712
-0.715
-50.12%
jan 1, 2014
0.835
+0.123
17.3%
jan 1, 2015
0.834
0.0
-0.05%
Ranking of countries by current statistics by years


Comments: