29
/
en
AIzaSyAYiBZKx7MnpbEhh9jyipgxe19OcubqV5w
April 1, 2024
92425
Brunei Darussalam
BRN
true
2
1
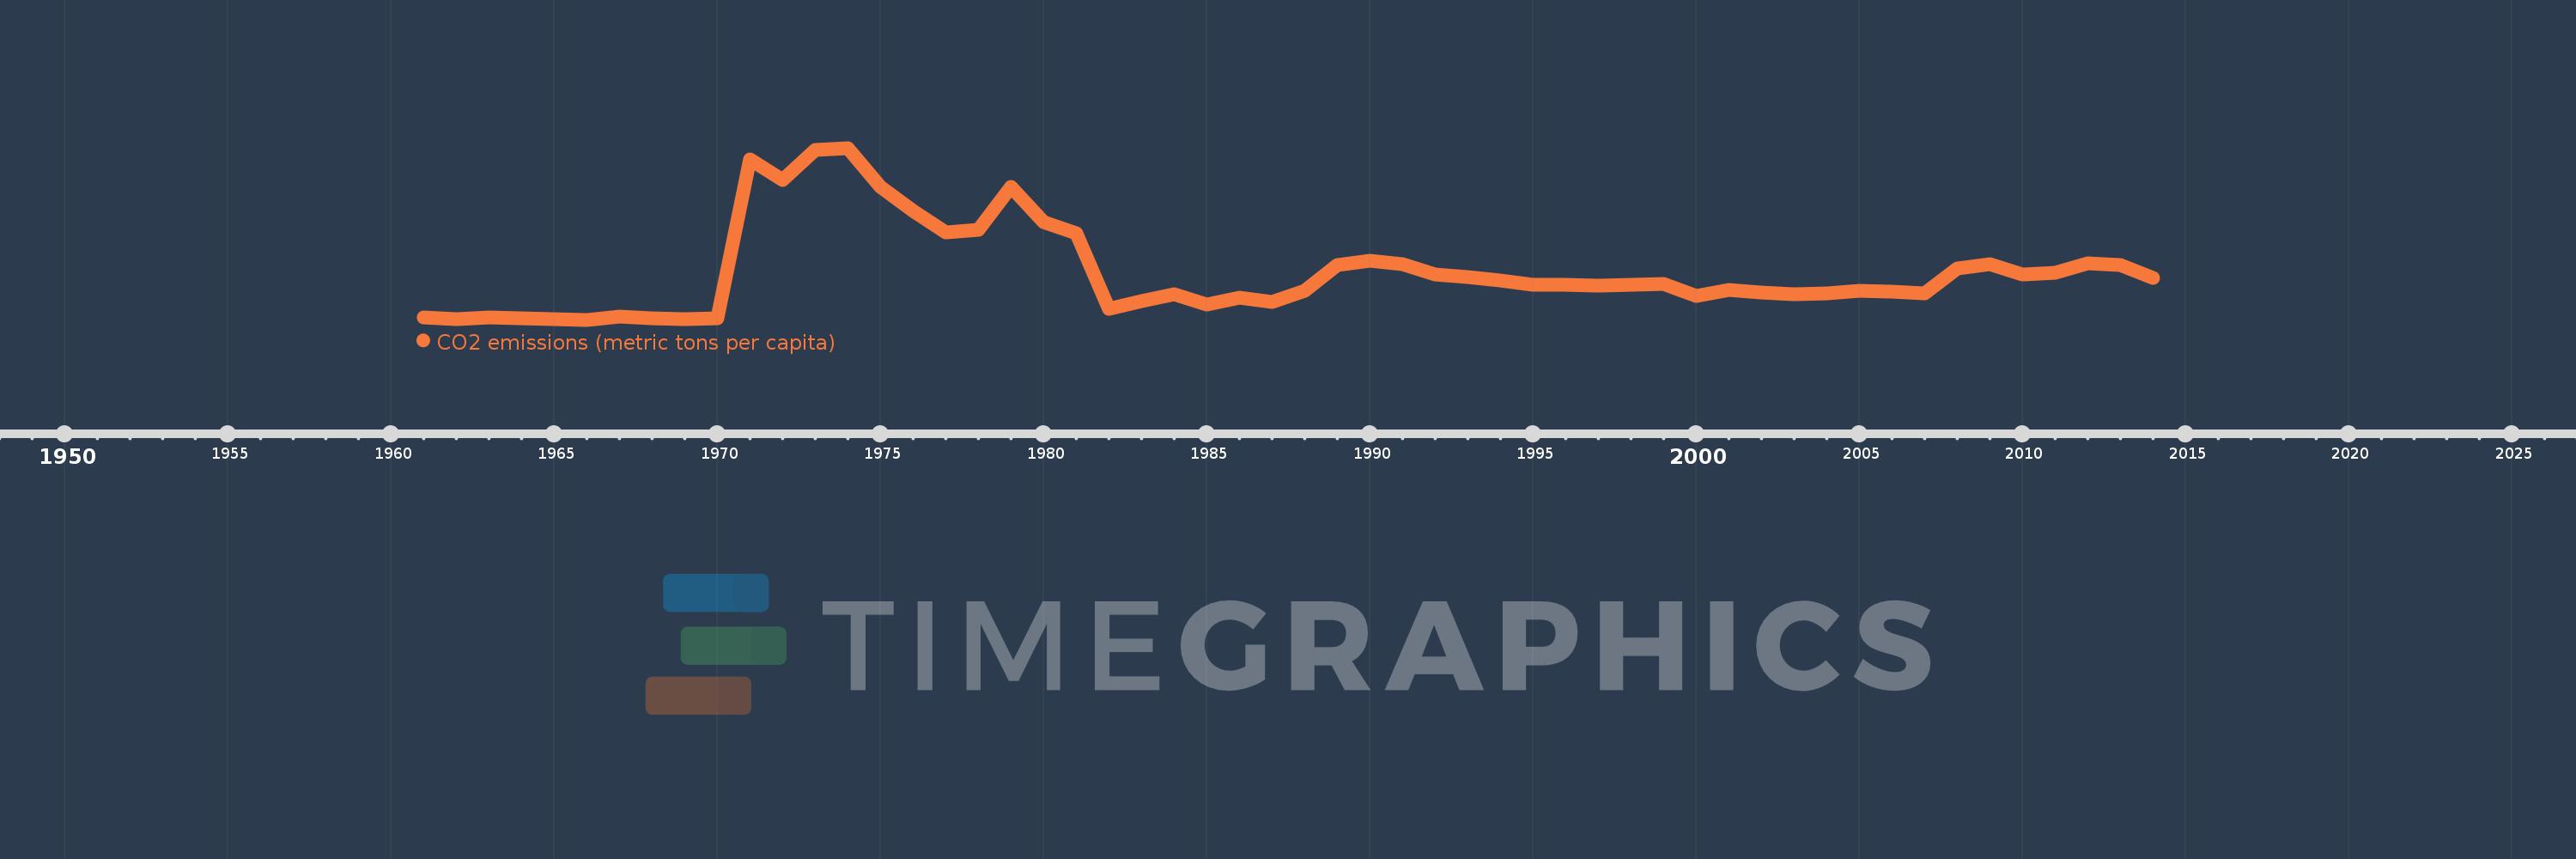
CO2 emissions (metric tons per capita)
2014,2013,2012,2011,2010,2009,2008,2007,2006,2005,2004,2003,2002,2001,2000,1999,1998,1997,1996,1995,1994,1993,1992,1991,1990,1989,1988,1987,1986,1985,1984,1983,1982,1981,1980,1979,1978,1977,1976,1975,1974,1973,1972,1971,1970,1969,1968,1967,1966,1965,1964,1963,1962,1961
This statistics in other country:
AfghanistanAlbaniaAlgeriaAndorraAngolaAntigua and BarbudaArab WorldArgentinaArmeniaArubaAustraliaAustriaAzerbaijanBahamas, TheBahrainBangladeshBarbadosBelarusBelgiumBelizeBeninBermudaBhutanBoliviaBosnia and HerzegovinaBotswanaBrazilBritish Virgin IslandsBrunei DarussalamBulgariaBurkina FasoBurundiCabo VerdeCambodiaCameroonCanadaCaribbean small statesCayman IslandsCentral African RepublicCentral Europe and the BalticsChadChileChinaColombiaComorosCongo, Dem. Rep.Congo, Rep.Costa RicaCote d'IvoireCroatiaCubaCuracaoCyprusCzech RepublicDenmarkDjiboutiDominicaDominican RepublicEarly-demographic dividendEast Asia & PacificEast Asia & Pacific (excluding high income)East Asia & Pacific (IDA & IBRD countries)EcuadorEgypt, Arab Rep.El SalvadorEquatorial GuineaEritreaEstoniaEthiopiaEuro areaEurope & Central AsiaEurope & Central Asia (excluding high income)Europe & Central Asia (IDA & IBRD countries)European UnionFaroe IslandsFijiFinlandFragile and conflict affected situationsFranceFrench PolynesiaGabonGambia, TheGeorgiaGermanyGhanaGibraltarGreeceGreenlandGrenadaGuatemalaGuineaGuinea-BissauGuyanaHaitiHeavily indebted poor countries (HIPC)High incomeHondurasHong Kong SAR, ChinaHungaryIBRD onlyIcelandIDA & IBRD totalIDA blendIDA onlyIDA totalIndiaIndonesiaIran, Islamic Rep.IraqIrelandIsraelItalyJamaicaJapanJordanKazakhstanKenyaKiribatiKorea, Dem. People’s Rep.Korea, Rep.KuwaitKyrgyz RepublicLao PDRLate-demographic dividendLatin America & Caribbean Latin America & Caribbean (excluding high income)Latin America & the Caribbean (IDA & IBRD countries)LatviaLeast developed countries: UN classificationLebanonLesothoLiberiaLibyaLiechtensteinLithuaniaLow & middle incomeLow incomeLower middle incomeLuxembourgMacao SAR, ChinaMacedonia, FYRMadagascarMalawiMalaysiaMaldivesMaliMaltaMarshall IslandsMauritaniaMauritiusMexicoMicronesia, Fed. Sts.Middle East & North AfricaMiddle East & North Africa (excluding high income)Middle East & North Africa (IDA & IBRD countries)Middle incomeMoldovaMongoliaMontenegroMoroccoMozambiqueMyanmarNamibiaNauruNepalNetherlandsNew CaledoniaNew ZealandNicaraguaNigerNigeriaNorth AmericaNorwayOECD membersOmanOther small statesPacific island small statesPakistanPalauPanamaPapua New GuineaParaguayPeruPhilippinesPolandPortugalPost-demographic dividendPre-demographic dividendQatarRomaniaRussian FederationRwandaSamoaSao Tome and PrincipeSaudi ArabiaSenegalSerbiaSeychellesSierra LeoneSingaporeSint Maarten (Dutch part)Slovak RepublicSloveniaSmall statesSolomon IslandsSomaliaSouth AfricaSouth AsiaSouth Asia (IDA & IBRD)South SudanSpainSri LankaSt. Kitts and NevisSt. LuciaSt. Vincent and the GrenadinesSub-Saharan Africa Sub-Saharan Africa (excluding high income)Sub-Saharan Africa (IDA & IBRD countries)SudanSurinameSwazilandSwedenSwitzerlandSyrian Arab RepublicTajikistanTanzaniaThailandTimor-LesteTogoTongaTrinidad and TobagoTunisiaTurkeyTurkmenistanTurks and Caicos IslandsUgandaUkraineUnited Arab EmiratesUnited KingdomUnited StatesUpper middle incomeUruguayUzbekistanVanuatuVenezuela, RBVietnamWest Bank and GazaWorldYemen, Rep.ZambiaZimbabwe Timeline:
This timeline shows a graph from 1961 to 2014 of Brunei Darussalam. No data until 1960. Number of actual observations by date: 54.
Source name:
World Development Indicators
Source organization:
Carbon Dioxide Information Analysis Center, Environmental Sciences Division, Oak Ridge National Laboratory, Tennessee, United States.
Categories, topics:
Climate Change, Environment
Last updated:
apr 23, 2017
Indicators value changes by year
Maximum:
67.413
jan 1, 1974
At the date of observation
Value
Absolute change
Change from previous value
jan 1, 1961
4.078
+4.078
0.0%
jan 1, 1962
3.552
-0.526
-12.9%
jan 1, 1963
4.133
+0.581
16.37%
jan 1, 1964
3.798
-0.335
-8.11%
jan 1, 1965
3.482
-0.316
-8.32%
jan 1, 1966
3.255
-0.228
-6.53%
jan 1, 1967
4.573
+1.318
40.5%
jan 1, 1968
3.905
-0.668
-14.6%
jan 1, 1969
3.631
-0.275
-7.03%
jan 1, 1970
3.937
+0.307
8.45%
jan 1, 1971
63.289
+59.352
1.51K%
jan 1, 1972
55.39
-7.899
-12.48%
jan 1, 1973
66.703
+11.313
20.42%
jan 1, 1974
67.413
+0.71
1.06%
jan 1, 1975
53.012
-14.401
-21.36%
jan 1, 1976
44.036
-8.976
-16.93%
jan 1, 1977
36.016
-8.02
-18.21%
jan 1, 1978
36.791
+0.775
2.15%
jan 1, 1979
52.904
+16.113
43.79%
jan 1, 1980
39.834
-13.07
-24.71%
jan 1, 1981
35.652
-4.181
-10.5%
jan 1, 1982
7.384
-28.268
-79.29%
jan 1, 1983
10.211
+2.827
38.28%
jan 1, 1984
12.83
+2.619
25.65%
jan 1, 1985
8.842
-3.988
-31.08%
jan 1, 1986
11.64
+2.797
31.64%
jan 1, 1987
10.022
-1.618
-13.9%
jan 1, 1988
14.063
+4.041
40.32%
jan 1, 1989
23.55
+9.487
67.46%
jan 1, 1990
25.417
+1.867
7.93%
jan 1, 1991
24.105
-1.312
-5.16%
jan 1, 1992
20.085
-4.02
-16.68%
jan 1, 1993
19.172
-0.914
-4.55%
jan 1, 1994
17.764
-1.408
-7.34%
jan 1, 1995
16.33
-1.433
-8.07%
jan 1, 1996
16.234
-0.097
-0.59%
jan 1, 1997
16.101
-0.133
-0.82%
jan 1, 1998
16.337
+0.236
1.47%
jan 1, 1999
16.63
+0.292
1.79%
jan 1, 2000
12.072
-4.558
-27.41%
jan 1, 2001
14.255
+2.183
18.09%
jan 1, 2002
13.37
-0.885
-6.21%
jan 1, 2003
12.751
-0.619
-4.63%
jan 1, 2004
13.134
+0.383
3.01%
jan 1, 2005
14.052
+0.918
6.99%
jan 1, 2006
13.831
-0.22
-1.57%
jan 1, 2007
13.208
-0.624
-4.51%
jan 1, 2008
22.474
+9.267
70.16%
jan 1, 2009
23.95
+1.476
6.57%
jan 1, 2010
20.311
-3.639
-15.19%
jan 1, 2011
20.857
+0.546
2.69%
jan 1, 2012
24.273
+3.416
16.38%
jan 1, 2013
23.801
-0.472
-1.94%
jan 1, 2014
18.919
-4.882
-20.51%
Ranking of countries by current statistics by years


Comments: