29
/
en
AIzaSyAYiBZKx7MnpbEhh9jyipgxe19OcubqV5w
April 1, 2024
131385
Faroe Islands
FRO
true
2
1
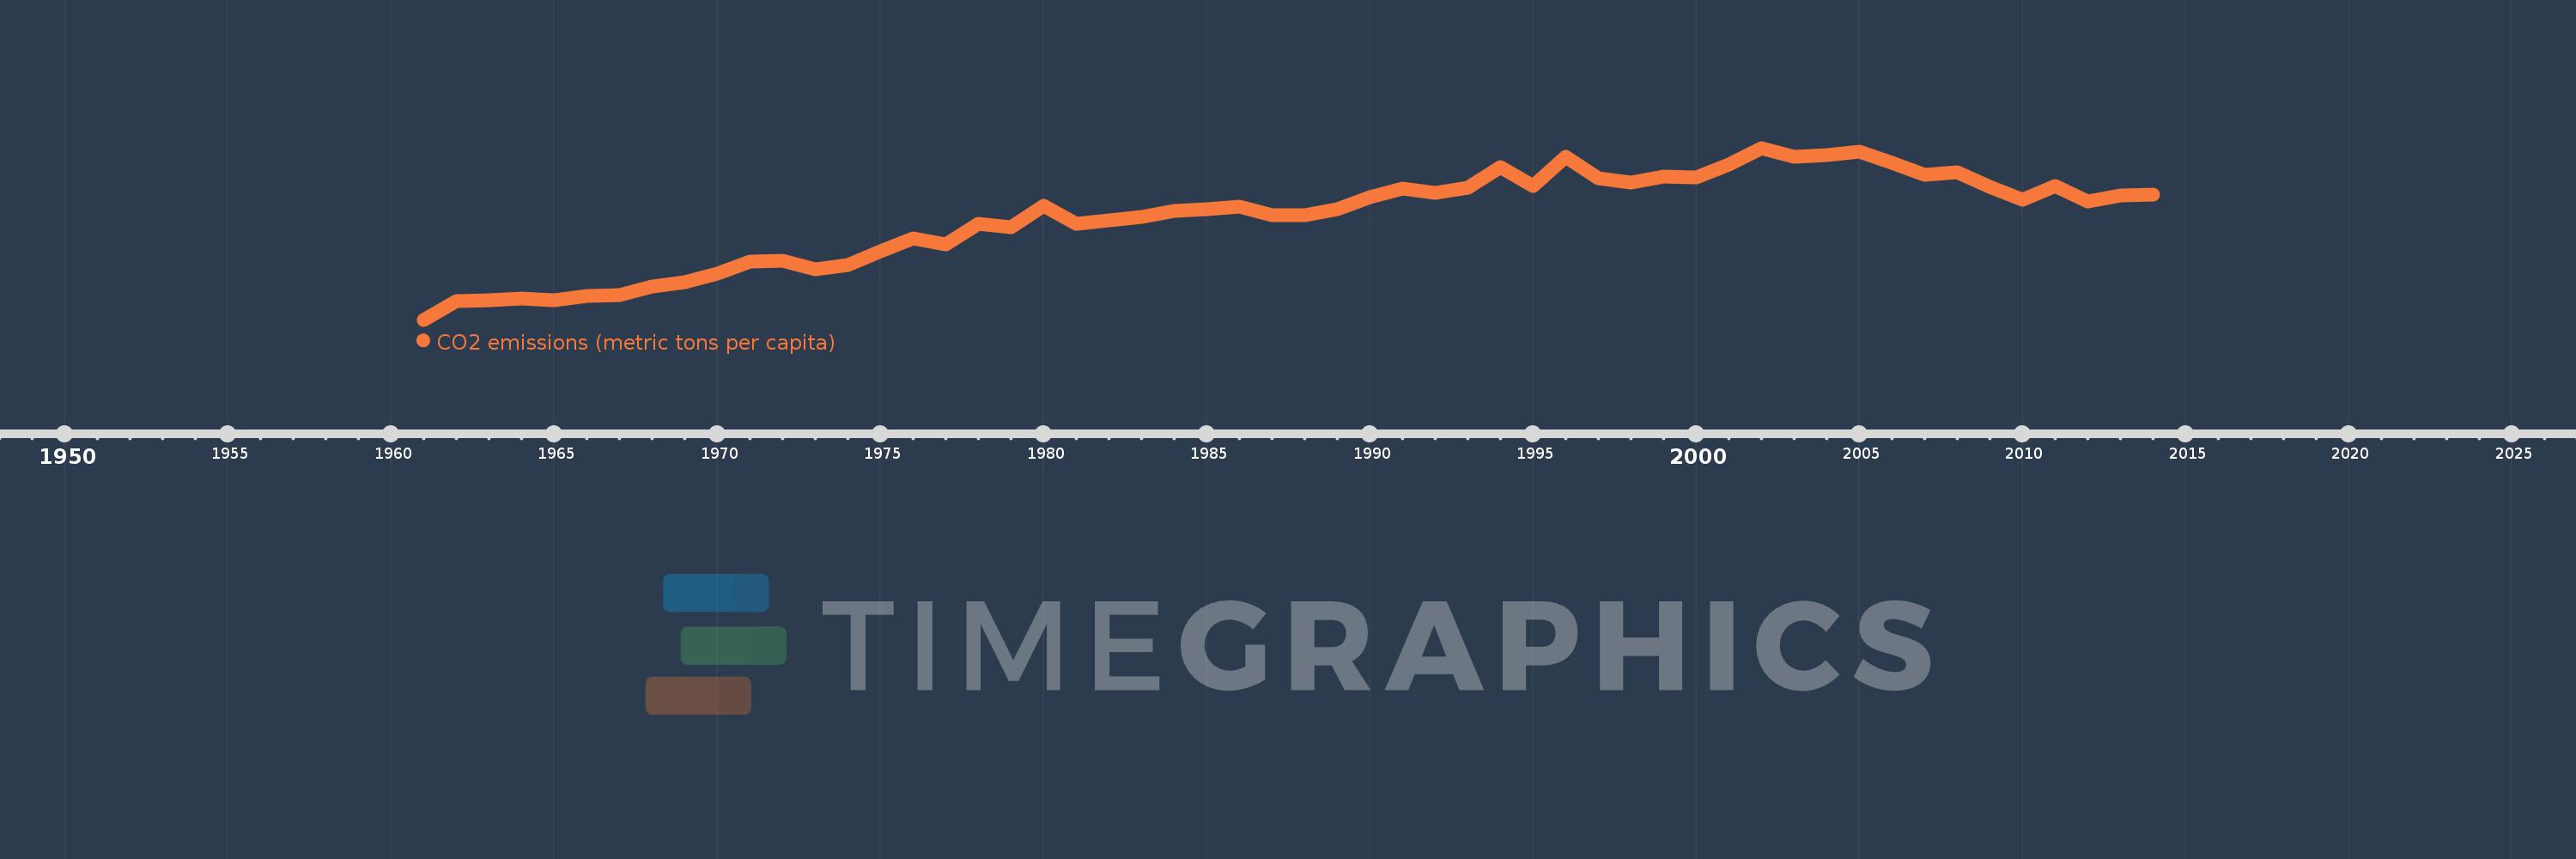
CO2 emissions (metric tons per capita)
2014,2013,2012,2011,2010,2009,2008,2007,2006,2005,2004,2003,2002,2001,2000,1999,1998,1997,1996,1995,1994,1993,1992,1991,1990,1989,1988,1987,1986,1985,1984,1983,1982,1981,1980,1979,1978,1977,1976,1975,1974,1973,1972,1971,1970,1969,1968,1967,1966,1965,1964,1963,1962,1961
This statistics in other country:
AfghanistanAlbaniaAlgeriaAndorraAngolaAntigua and BarbudaArab WorldArgentinaArmeniaArubaAustraliaAustriaAzerbaijanBahamas, TheBahrainBangladeshBarbadosBelarusBelgiumBelizeBeninBermudaBhutanBoliviaBosnia and HerzegovinaBotswanaBrazilBritish Virgin IslandsBrunei DarussalamBulgariaBurkina FasoBurundiCabo VerdeCambodiaCameroonCanadaCaribbean small statesCayman IslandsCentral African RepublicCentral Europe and the BalticsChadChileChinaColombiaComorosCongo, Dem. Rep.Congo, Rep.Costa RicaCote d'IvoireCroatiaCubaCuracaoCyprusCzech RepublicDenmarkDjiboutiDominicaDominican RepublicEarly-demographic dividendEast Asia & PacificEast Asia & Pacific (excluding high income)East Asia & Pacific (IDA & IBRD countries)EcuadorEgypt, Arab Rep.El SalvadorEquatorial GuineaEritreaEstoniaEthiopiaEuro areaEurope & Central AsiaEurope & Central Asia (excluding high income)Europe & Central Asia (IDA & IBRD countries)European UnionFaroe IslandsFijiFinlandFragile and conflict affected situationsFranceFrench PolynesiaGabonGambia, TheGeorgiaGermanyGhanaGibraltarGreeceGreenlandGrenadaGuatemalaGuineaGuinea-BissauGuyanaHaitiHeavily indebted poor countries (HIPC)High incomeHondurasHong Kong SAR, ChinaHungaryIBRD onlyIcelandIDA & IBRD totalIDA blendIDA onlyIDA totalIndiaIndonesiaIran, Islamic Rep.IraqIrelandIsraelItalyJamaicaJapanJordanKazakhstanKenyaKiribatiKorea, Dem. People’s Rep.Korea, Rep.KuwaitKyrgyz RepublicLao PDRLate-demographic dividendLatin America & Caribbean Latin America & Caribbean (excluding high income)Latin America & the Caribbean (IDA & IBRD countries)LatviaLeast developed countries: UN classificationLebanonLesothoLiberiaLibyaLiechtensteinLithuaniaLow & middle incomeLow incomeLower middle incomeLuxembourgMacao SAR, ChinaMacedonia, FYRMadagascarMalawiMalaysiaMaldivesMaliMaltaMarshall IslandsMauritaniaMauritiusMexicoMicronesia, Fed. Sts.Middle East & North AfricaMiddle East & North Africa (excluding high income)Middle East & North Africa (IDA & IBRD countries)Middle incomeMoldovaMongoliaMontenegroMoroccoMozambiqueMyanmarNamibiaNauruNepalNetherlandsNew CaledoniaNew ZealandNicaraguaNigerNigeriaNorth AmericaNorwayOECD membersOmanOther small statesPacific island small statesPakistanPalauPanamaPapua New GuineaParaguayPeruPhilippinesPolandPortugalPost-demographic dividendPre-demographic dividendQatarRomaniaRussian FederationRwandaSamoaSao Tome and PrincipeSaudi ArabiaSenegalSerbiaSeychellesSierra LeoneSingaporeSint Maarten (Dutch part)Slovak RepublicSloveniaSmall statesSolomon IslandsSomaliaSouth AfricaSouth AsiaSouth Asia (IDA & IBRD)South SudanSpainSri LankaSt. Kitts and NevisSt. LuciaSt. Vincent and the GrenadinesSub-Saharan Africa Sub-Saharan Africa (excluding high income)Sub-Saharan Africa (IDA & IBRD countries)SudanSurinameSwazilandSwedenSwitzerlandSyrian Arab RepublicTajikistanTanzaniaThailandTimor-LesteTogoTongaTrinidad and TobagoTunisiaTurkeyTurkmenistanTurks and Caicos IslandsUgandaUkraineUnited Arab EmiratesUnited KingdomUnited StatesUpper middle incomeUruguayUzbekistanVanuatuVenezuela, RBVietnamWest Bank and GazaWorldYemen, Rep.ZambiaZimbabwe Timeline:
This timeline shows a graph from 1961 to 2014 of Faroe Islands. No data until 1960. Number of actual observations by date: 54.
Source name:
World Development Indicators
Source organization:
Carbon Dioxide Information Analysis Center, Environmental Sciences Division, Oak Ridge National Laboratory, Tennessee, United States.
Categories, topics:
Climate Change, Environment
Last updated:
apr 23, 2017
Indicators value changes by year
Maximum:
16.224
jan 1, 2002
At the date of observation
Value
Absolute change
Change from previous value
jan 1, 1961
1.712
+1.712
0.0%
jan 1, 1962
3.273
+1.561
91.16%
jan 1, 1963
3.338
+0.065
1.98%
jan 1, 1964
3.507
+0.169
5.06%
jan 1, 1965
3.366
-0.141
-4.01%
jan 1, 1966
3.731
+0.365
10.84%
jan 1, 1967
3.786
+0.055
1.47%
jan 1, 1968
4.527
+0.741
19.58%
jan 1, 1969
4.861
+0.334
7.37%
jan 1, 1970
5.573
+0.712
14.64%
jan 1, 1971
6.652
+1.079
19.37%
jan 1, 1972
6.679
+0.026
0.4%
jan 1, 1973
5.963
-0.716
-10.72%
jan 1, 1974
6.368
+0.406
6.81%
jan 1, 1975
7.496
+1.127
17.7%
jan 1, 1976
8.595
+1.1
14.67%
jan 1, 1977
8.055
-0.541
-6.29%
jan 1, 1978
9.821
+1.766
21.93%
jan 1, 1979
9.529
-0.292
-2.97%
jan 1, 1980
11.312
+1.783
18.71%
jan 1, 1981
9.805
-1.507
-13.32%
jan 1, 1982
10.102
+0.297
3.03%
jan 1, 1983
10.393
+0.291
2.88%
jan 1, 1984
10.92
+0.527
5.08%
jan 1, 1985
11.024
+0.104
0.95%
jan 1, 1986
11.279
+0.255
2.32%
jan 1, 1987
10.567
-0.712
-6.32%
jan 1, 1988
10.567
+0.0
0.0%
jan 1, 1989
11.05
+0.482
4.56%
jan 1, 1990
12.044
+0.995
9.0%
jan 1, 1991
12.826
+0.782
6.49%
jan 1, 1992
12.431
-0.395
-3.08%
jan 1, 1993
12.834
+0.403
3.24%
jan 1, 1994
14.587
+1.753
13.66%
jan 1, 1995
12.991
-1.596
-10.94%
jan 1, 1996
15.467
+2.476
19.06%
jan 1, 1997
13.643
-1.824
-11.79%
jan 1, 1998
13.277
-0.366
-2.68%
jan 1, 1999
13.814
+0.537
4.05%
jan 1, 2000
13.756
-0.059
-0.43%
jan 1, 2001
14.829
+1.073
7.8%
jan 1, 2002
16.224
+1.396
9.41%
jan 1, 2003
15.456
-0.769
-4.74%
jan 1, 2004
15.646
+0.19
1.23%
jan 1, 2005
15.933
+0.287
1.83%
jan 1, 2006
14.945
-0.987
-6.2%
jan 1, 2007
13.986
-0.959
-6.42%
jan 1, 2008
14.185
+0.199
1.43%
jan 1, 2009
12.97
-1.215
-8.57%
jan 1, 2010
11.843
-1.127
-8.69%
jan 1, 2011
12.987
+1.144
9.66%
jan 1, 2012
11.721
-1.265
-9.74%
jan 1, 2013
12.2
+0.479
4.08%
jan 1, 2014
12.301
+0.101
0.83%
Ranking of countries by current statistics by years


Comments: