29
/
en
AIzaSyAYiBZKx7MnpbEhh9jyipgxe19OcubqV5w
April 1, 2024
176159
Lebanon
LBN
true
2
1
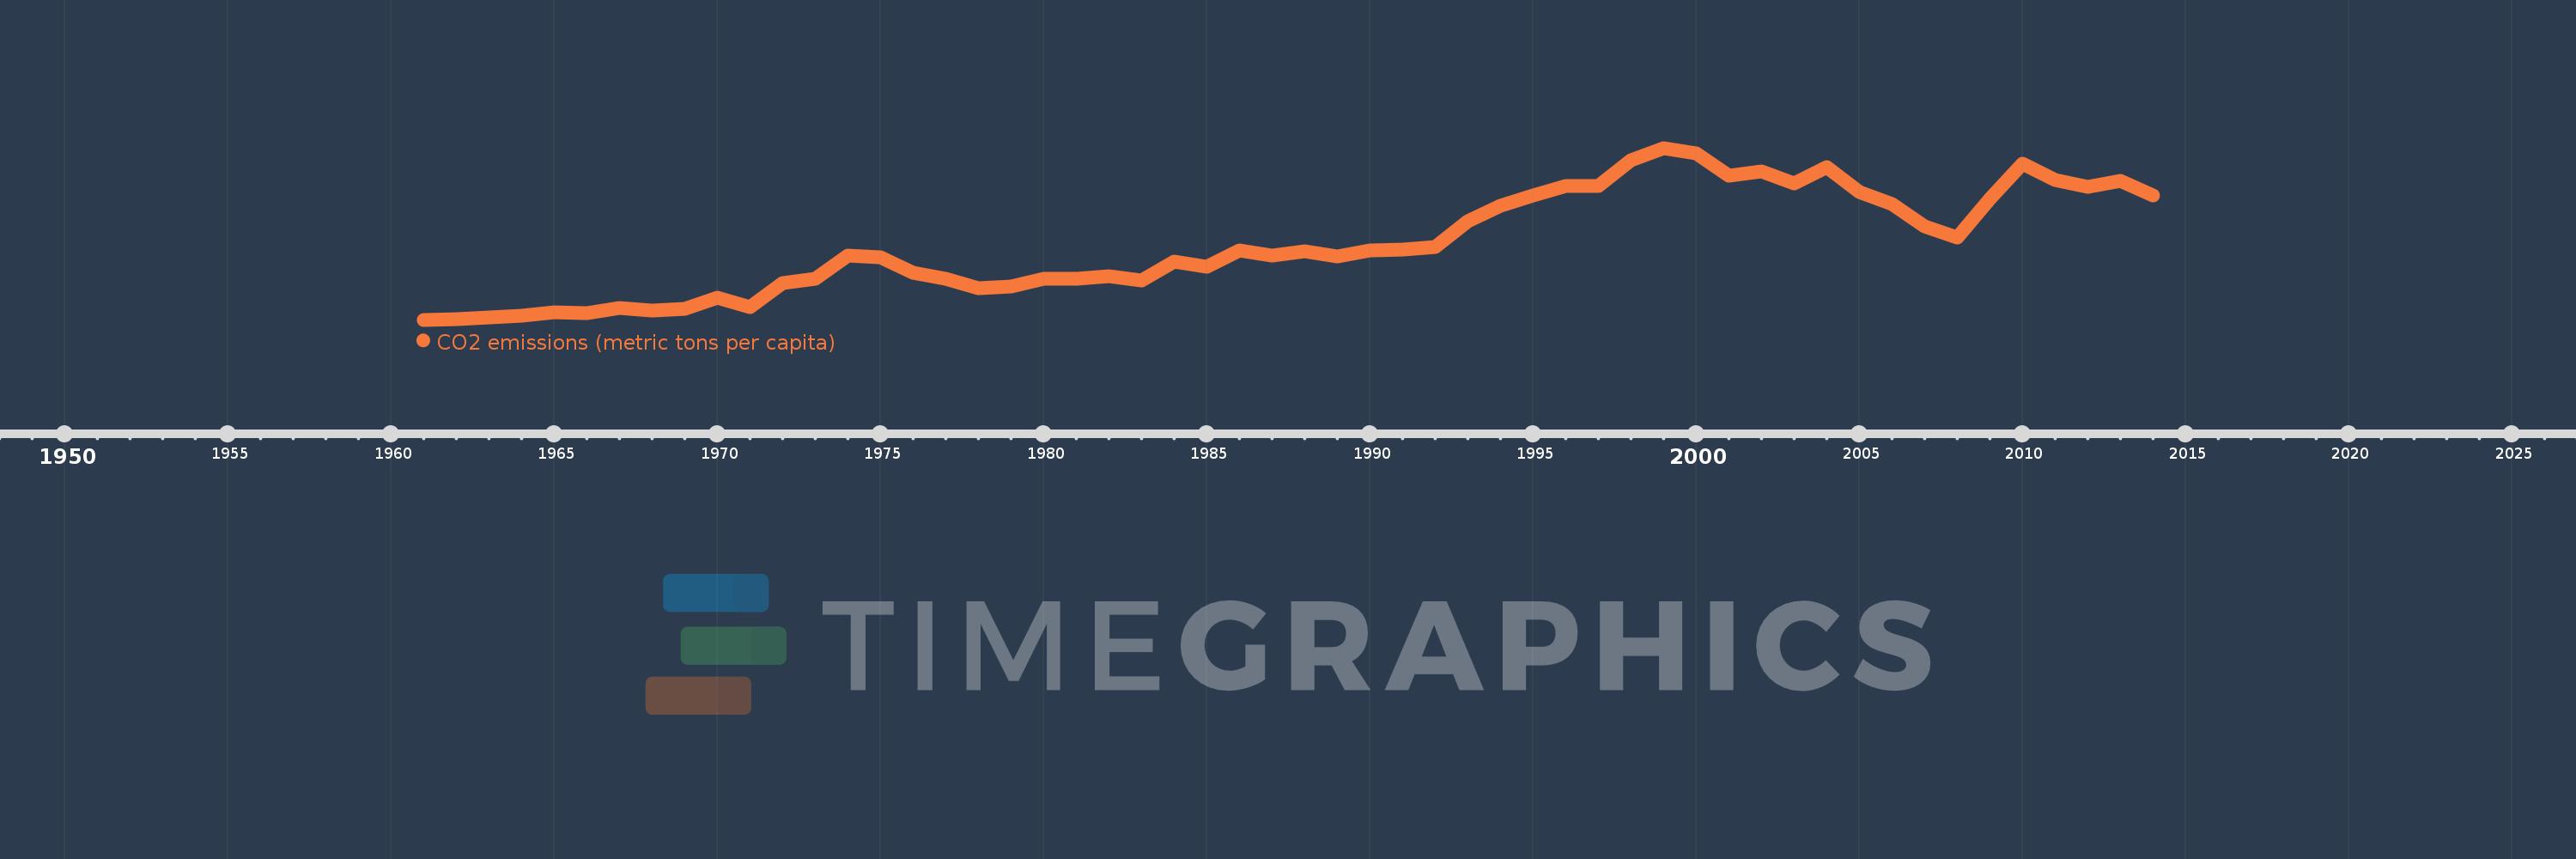
CO2 emissions (metric tons per capita)
2014,2013,2012,2011,2010,2009,2008,2007,2006,2005,2004,2003,2002,2001,2000,1999,1998,1997,1996,1995,1994,1993,1992,1991,1990,1989,1988,1987,1986,1985,1984,1983,1982,1981,1980,1979,1978,1977,1976,1975,1974,1973,1972,1971,1970,1969,1968,1967,1966,1965,1964,1963,1962,1961
This statistics in other country:
AfghanistanAlbaniaAlgeriaAndorraAngolaAntigua and BarbudaArab WorldArgentinaArmeniaArubaAustraliaAustriaAzerbaijanBahamas, TheBahrainBangladeshBarbadosBelarusBelgiumBelizeBeninBermudaBhutanBoliviaBosnia and HerzegovinaBotswanaBrazilBritish Virgin IslandsBrunei DarussalamBulgariaBurkina FasoBurundiCabo VerdeCambodiaCameroonCanadaCaribbean small statesCayman IslandsCentral African RepublicCentral Europe and the BalticsChadChileChinaColombiaComorosCongo, Dem. Rep.Congo, Rep.Costa RicaCote d'IvoireCroatiaCubaCuracaoCyprusCzech RepublicDenmarkDjiboutiDominicaDominican RepublicEarly-demographic dividendEast Asia & PacificEast Asia & Pacific (excluding high income)East Asia & Pacific (IDA & IBRD countries)EcuadorEgypt, Arab Rep.El SalvadorEquatorial GuineaEritreaEstoniaEthiopiaEuro areaEurope & Central AsiaEurope & Central Asia (excluding high income)Europe & Central Asia (IDA & IBRD countries)European UnionFaroe IslandsFijiFinlandFragile and conflict affected situationsFranceFrench PolynesiaGabonGambia, TheGeorgiaGermanyGhanaGibraltarGreeceGreenlandGrenadaGuatemalaGuineaGuinea-BissauGuyanaHaitiHeavily indebted poor countries (HIPC)High incomeHondurasHong Kong SAR, ChinaHungaryIBRD onlyIcelandIDA & IBRD totalIDA blendIDA onlyIDA totalIndiaIndonesiaIran, Islamic Rep.IraqIrelandIsraelItalyJamaicaJapanJordanKazakhstanKenyaKiribatiKorea, Dem. People’s Rep.Korea, Rep.KuwaitKyrgyz RepublicLao PDRLate-demographic dividendLatin America & Caribbean Latin America & Caribbean (excluding high income)Latin America & the Caribbean (IDA & IBRD countries)LatviaLeast developed countries: UN classificationLebanonLesothoLiberiaLibyaLiechtensteinLithuaniaLow & middle incomeLow incomeLower middle incomeLuxembourgMacao SAR, ChinaMacedonia, FYRMadagascarMalawiMalaysiaMaldivesMaliMaltaMarshall IslandsMauritaniaMauritiusMexicoMicronesia, Fed. Sts.Middle East & North AfricaMiddle East & North Africa (excluding high income)Middle East & North Africa (IDA & IBRD countries)Middle incomeMoldovaMongoliaMontenegroMoroccoMozambiqueMyanmarNamibiaNauruNepalNetherlandsNew CaledoniaNew ZealandNicaraguaNigerNigeriaNorth AmericaNorwayOECD membersOmanOther small statesPacific island small statesPakistanPalauPanamaPapua New GuineaParaguayPeruPhilippinesPolandPortugalPost-demographic dividendPre-demographic dividendQatarRomaniaRussian FederationRwandaSamoaSao Tome and PrincipeSaudi ArabiaSenegalSerbiaSeychellesSierra LeoneSingaporeSint Maarten (Dutch part)Slovak RepublicSloveniaSmall statesSolomon IslandsSomaliaSouth AfricaSouth AsiaSouth Asia (IDA & IBRD)South SudanSpainSri LankaSt. Kitts and NevisSt. LuciaSt. Vincent and the GrenadinesSub-Saharan Africa Sub-Saharan Africa (excluding high income)Sub-Saharan Africa (IDA & IBRD countries)SudanSurinameSwazilandSwedenSwitzerlandSyrian Arab RepublicTajikistanTanzaniaThailandTimor-LesteTogoTongaTrinidad and TobagoTunisiaTurkeyTurkmenistanTurks and Caicos IslandsUgandaUkraineUnited Arab EmiratesUnited KingdomUnited StatesUpper middle incomeUruguayUzbekistanVanuatuVenezuela, RBVietnamWest Bank and GazaWorldYemen, Rep.ZambiaZimbabwe Timeline:
This timeline shows a graph from 1961 to 2014 of Lebanon. No data until 1960. Number of actual observations by date: 54.
Source name:
World Development Indicators
Source organization:
Carbon Dioxide Information Analysis Center, Environmental Sciences Division, Oak Ridge National Laboratory, Tennessee, United States.
Categories, topics:
Climate Change, Environment
Last updated:
apr 23, 2017
Indicators value changes by year
At the date of observation
Value
Absolute change
Change from previous value
jan 1, 1961
1.43
+1.43
0.0%
jan 1, 1962
1.44
+0.009
0.65%
jan 1, 1963
1.484
+0.044
3.07%
jan 1, 1964
1.526
+0.042
2.84%
jan 1, 1965
1.601
+0.075
4.9%
jan 1, 1966
1.586
-0.015
-0.91%
jan 1, 1967
1.699
+0.113
7.12%
jan 1, 1968
1.642
-0.057
-3.34%
jan 1, 1969
1.673
+0.031
1.9%
jan 1, 1970
1.934
+0.261
15.57%
jan 1, 1971
1.719
-0.215
-11.12%
jan 1, 1972
2.269
+0.549
31.96%
jan 1, 1973
2.37
+0.102
4.48%
jan 1, 1974
2.892
+0.522
22.01%
jan 1, 1975
2.852
-0.04
-1.37%
jan 1, 1976
2.497
-0.355
-12.44%
jan 1, 1977
2.358
-0.139
-5.56%
jan 1, 1978
2.139
-0.22
-9.31%
jan 1, 1979
2.193
+0.055
2.55%
jan 1, 1980
2.366
+0.172
7.86%
jan 1, 1981
2.372
+0.006
0.25%
jan 1, 1982
2.428
+0.056
2.38%
jan 1, 1983
2.322
-0.106
-4.36%
jan 1, 1984
2.761
+0.438
18.88%
jan 1, 1985
2.644
-0.117
-4.23%
jan 1, 1986
3.01
+0.366
13.85%
jan 1, 1987
2.898
-0.112
-3.71%
jan 1, 1988
2.982
+0.084
2.89%
jan 1, 1989
2.871
-0.111
-3.74%
jan 1, 1990
3.009
+0.138
4.81%
jan 1, 1991
3.039
+0.03
1.01%
jan 1, 1992
3.08
+0.041
1.36%
jan 1, 1993
3.671
+0.591
19.18%
jan 1, 1994
4.027
+0.356
9.71%
jan 1, 1995
4.27
+0.243
6.03%
jan 1, 1996
4.476
+0.206
4.83%
jan 1, 1997
4.48
+0.004
0.08%
jan 1, 1998
5.059
+0.579
12.93%
jan 1, 1999
5.346
+0.287
5.67%
jan 1, 2000
5.224
-0.122
-2.29%
jan 1, 2001
4.713
-0.511
-9.79%
jan 1, 2002
4.813
+0.1
2.13%
jan 1, 2003
4.543
-0.271
-5.62%
jan 1, 2004
4.912
+0.369
8.13%
jan 1, 2005
4.348
-0.564
-11.47%
jan 1, 2006
4.065
-0.283
-6.51%
jan 1, 2007
3.564
-0.501
-12.33%
jan 1, 2008
3.3
-0.264
-7.39%
jan 1, 2009
4.193
+0.893
27.05%
jan 1, 2010
4.993
+0.8
19.08%
jan 1, 2011
4.624
-0.369
-7.39%
jan 1, 2012
4.454
-0.17
-3.68%
jan 1, 2013
4.598
+0.144
3.23%
jan 1, 2014
4.271
-0.327
-7.1%
Ranking of countries by current statistics by years


Comments: