29
/
en
AIzaSyAYiBZKx7MnpbEhh9jyipgxe19OcubqV5w
April 1, 2024
55373
Pre-demographic dividend
PRE
false
2
1
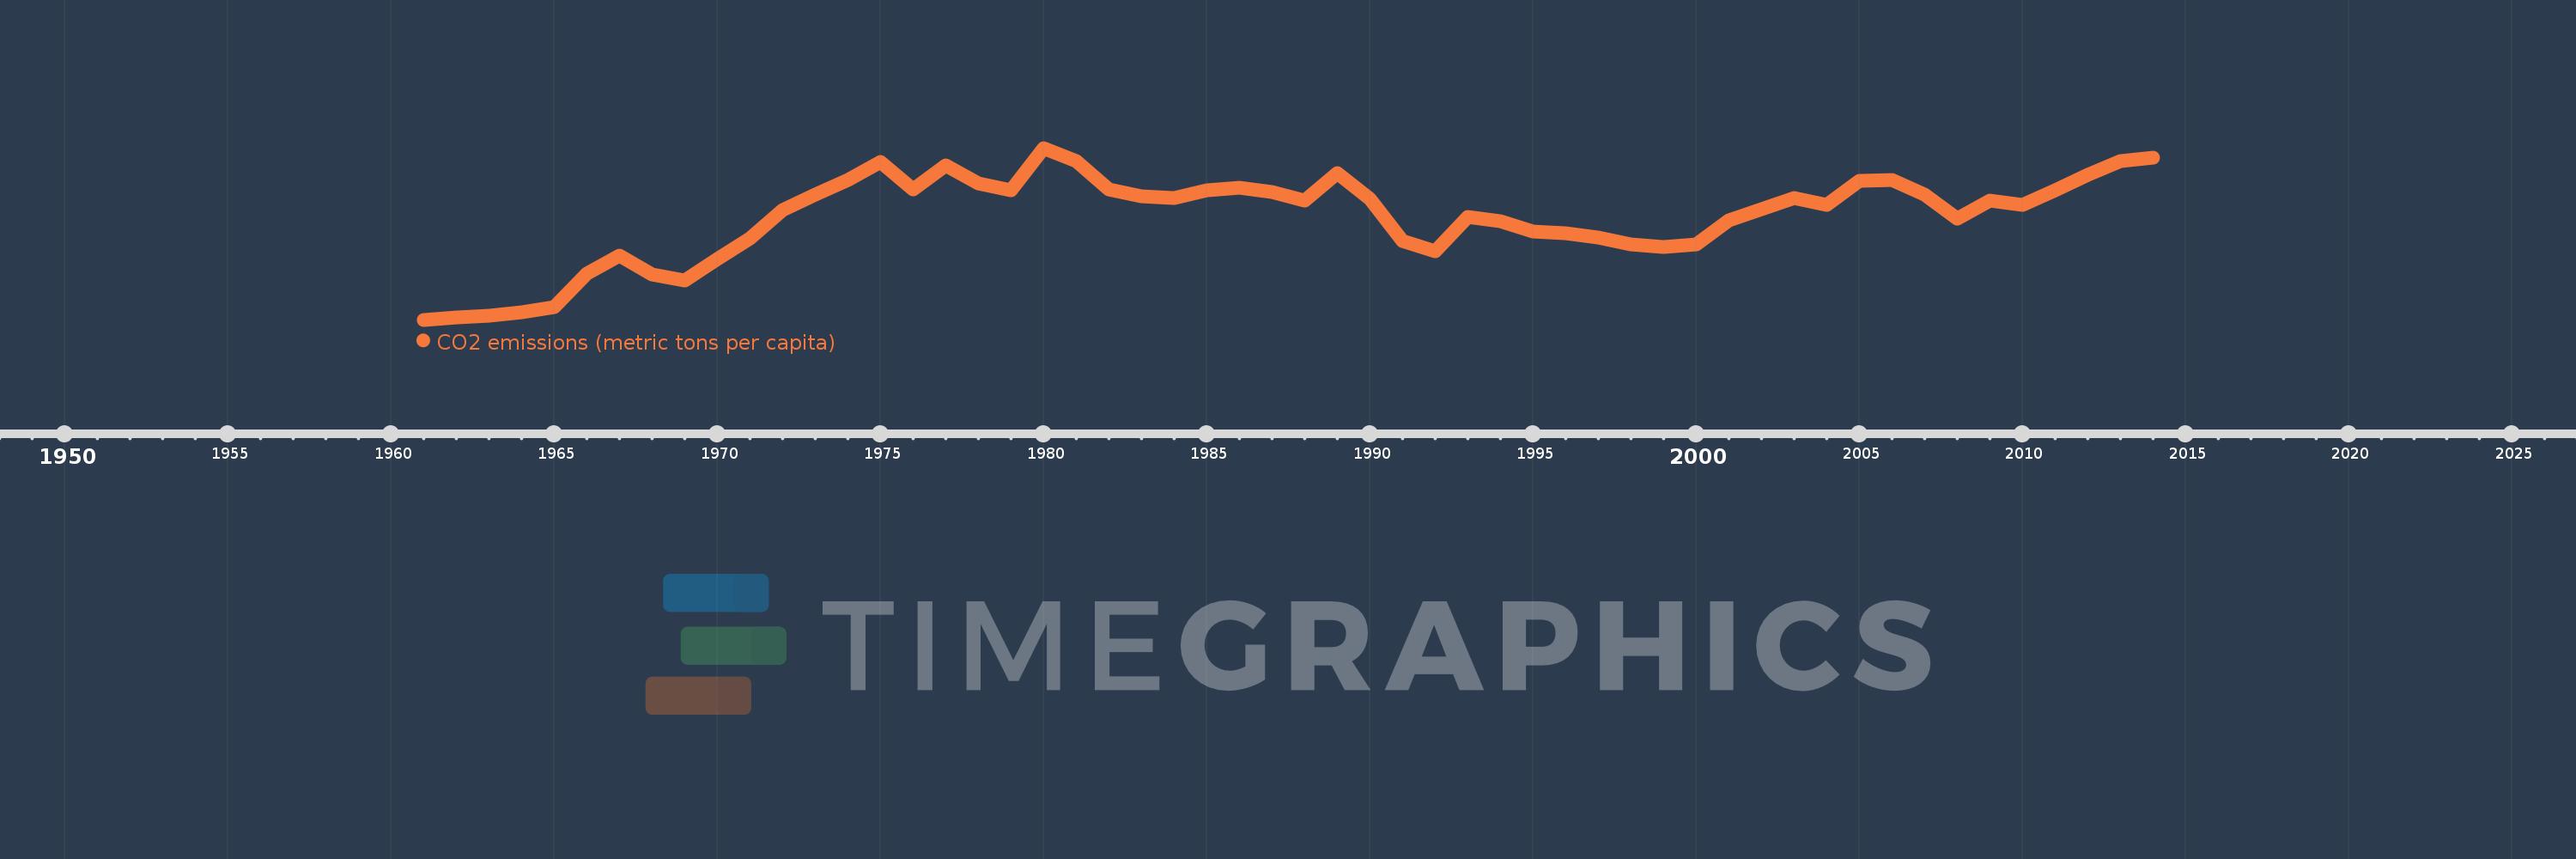
CO2 emissions (metric tons per capita)
2014,2013,2012,2011,2010,2009,2008,2007,2006,2005,2004,2003,2002,2001,2000,1999,1998,1997,1996,1995,1994,1993,1992,1991,1990,1989,1988,1987,1986,1985,1984,1983,1982,1981,1980,1979,1978,1977,1976,1975,1974,1973,1972,1971,1970,1969,1968,1967,1966,1965,1964,1963,1962,1961
This statistics in other country:
AfghanistanAlbaniaAlgeriaAndorraAngolaAntigua and BarbudaArab WorldArgentinaArmeniaArubaAustraliaAustriaAzerbaijanBahamas, TheBahrainBangladeshBarbadosBelarusBelgiumBelizeBeninBermudaBhutanBoliviaBosnia and HerzegovinaBotswanaBrazilBritish Virgin IslandsBrunei DarussalamBulgariaBurkina FasoBurundiCabo VerdeCambodiaCameroonCanadaCaribbean small statesCayman IslandsCentral African RepublicCentral Europe and the BalticsChadChileChinaColombiaComorosCongo, Dem. Rep.Congo, Rep.Costa RicaCote d'IvoireCroatiaCubaCuracaoCyprusCzech RepublicDenmarkDjiboutiDominicaDominican RepublicEarly-demographic dividendEast Asia & PacificEast Asia & Pacific (excluding high income)East Asia & Pacific (IDA & IBRD countries)EcuadorEgypt, Arab Rep.El SalvadorEquatorial GuineaEritreaEstoniaEthiopiaEuro areaEurope & Central AsiaEurope & Central Asia (excluding high income)Europe & Central Asia (IDA & IBRD countries)European UnionFaroe IslandsFijiFinlandFragile and conflict affected situationsFranceFrench PolynesiaGabonGambia, TheGeorgiaGermanyGhanaGibraltarGreeceGreenlandGrenadaGuatemalaGuineaGuinea-BissauGuyanaHaitiHeavily indebted poor countries (HIPC)High incomeHondurasHong Kong SAR, ChinaHungaryIBRD onlyIcelandIDA & IBRD totalIDA blendIDA onlyIDA totalIndiaIndonesiaIran, Islamic Rep.IraqIrelandIsraelItalyJamaicaJapanJordanKazakhstanKenyaKiribatiKorea, Dem. People’s Rep.Korea, Rep.KuwaitKyrgyz RepublicLao PDRLate-demographic dividendLatin America & Caribbean Latin America & Caribbean (excluding high income)Latin America & the Caribbean (IDA & IBRD countries)LatviaLeast developed countries: UN classificationLebanonLesothoLiberiaLibyaLiechtensteinLithuaniaLow & middle incomeLow incomeLower middle incomeLuxembourgMacao SAR, ChinaMacedonia, FYRMadagascarMalawiMalaysiaMaldivesMaliMaltaMarshall IslandsMauritaniaMauritiusMexicoMicronesia, Fed. Sts.Middle East & North AfricaMiddle East & North Africa (excluding high income)Middle East & North Africa (IDA & IBRD countries)Middle incomeMoldovaMongoliaMontenegroMoroccoMozambiqueMyanmarNamibiaNauruNepalNetherlandsNew CaledoniaNew ZealandNicaraguaNigerNigeriaNorth AmericaNorwayOECD membersOmanOther small statesPacific island small statesPakistanPalauPanamaPapua New GuineaParaguayPeruPhilippinesPolandPortugalPost-demographic dividendPre-demographic dividendQatarRomaniaRussian FederationRwandaSamoaSao Tome and PrincipeSaudi ArabiaSenegalSerbiaSeychellesSierra LeoneSingaporeSint Maarten (Dutch part)Slovak RepublicSloveniaSmall statesSolomon IslandsSomaliaSouth AfricaSouth AsiaSouth Asia (IDA & IBRD)South SudanSpainSri LankaSt. Kitts and NevisSt. LuciaSt. Vincent and the GrenadinesSub-Saharan Africa Sub-Saharan Africa (excluding high income)Sub-Saharan Africa (IDA & IBRD countries)SudanSurinameSwazilandSwedenSwitzerlandSyrian Arab RepublicTajikistanTanzaniaThailandTimor-LesteTogoTongaTrinidad and TobagoTunisiaTurkeyTurkmenistanTurks and Caicos IslandsUgandaUkraineUnited Arab EmiratesUnited KingdomUnited StatesUpper middle incomeUruguayUzbekistanVanuatuVenezuela, RBVietnamWest Bank and GazaWorldYemen, Rep.ZambiaZimbabwe Timeline:
This timeline shows a graph from 1961 to 2014 of Pre-demographic dividend. No data until 1960. Number of actual observations by date: 54.
Source name:
World Development Indicators
Source organization:
Carbon Dioxide Information Analysis Center, Environmental Sciences Division, Oak Ridge National Laboratory, Tennessee, United States.
Categories, topics:
Climate Change, Environment
Last updated:
apr 23, 2017
Indicators value changes by year
At the date of observation
Value
Absolute change
Change from previous value
jan 1, 1961
0.157
+0.157
0.0%
jan 1, 1962
0.163
+0.007
4.29%
jan 1, 1963
0.167
+0.003
1.93%
jan 1, 1964
0.175
+0.009
5.19%
jan 1, 1965
0.187
+0.012
6.76%
jan 1, 1966
0.268
+0.081
43.16%
jan 1, 1967
0.312
+0.045
16.64%
jan 1, 1968
0.267
-0.045
-14.43%
jan 1, 1969
0.251
-0.016
-6.05%
jan 1, 1970
0.304
+0.053
21.17%
jan 1, 1971
0.353
+0.049
15.96%
jan 1, 1972
0.422
+0.069
19.55%
jan 1, 1973
0.458
+0.036
8.64%
jan 1, 1974
0.494
+0.036
7.89%
jan 1, 1975
0.537
+0.043
8.63%
jan 1, 1976
0.472
-0.065
-12.09%
jan 1, 1977
0.53
+0.058
12.3%
jan 1, 1978
0.485
-0.046
-8.63%
jan 1, 1979
0.469
-0.015
-3.16%
jan 1, 1980
0.571
+0.102
21.74%
jan 1, 1981
0.54
-0.031
-5.49%
jan 1, 1982
0.472
-0.068
-12.56%
jan 1, 1983
0.454
-0.018
-3.73%
jan 1, 1984
0.45
-0.005
-1.09%
jan 1, 1985
0.468
+0.019
4.18%
jan 1, 1986
0.475
+0.007
1.39%
jan 1, 1987
0.464
-0.011
-2.35%
jan 1, 1988
0.445
-0.019
-4.07%
jan 1, 1989
0.51
+0.065
14.59%
jan 1, 1990
0.448
-0.061
-12.06%
jan 1, 1991
0.346
-0.102
-22.76%
jan 1, 1992
0.322
-0.024
-6.97%
jan 1, 1993
0.404
+0.082
25.5%
jan 1, 1994
0.395
-0.01
-2.36%
jan 1, 1995
0.37
-0.025
-6.36%
jan 1, 1996
0.365
-0.005
-1.29%
jan 1, 1997
0.356
-0.008
-2.28%
jan 1, 1998
0.338
-0.019
-5.23%
jan 1, 1999
0.333
-0.005
-1.48%
jan 1, 2000
0.338
+0.005
1.4%
jan 1, 2001
0.396
+0.058
17.2%
jan 1, 2002
0.423
+0.027
6.94%
jan 1, 2003
0.45
+0.027
6.4%
jan 1, 2004
0.434
-0.016
-3.6%
jan 1, 2005
0.492
+0.058
13.46%
jan 1, 2006
0.494
+0.002
0.31%
jan 1, 2007
0.458
-0.036
-7.2%
jan 1, 2008
0.4
-0.058
-12.76%
jan 1, 2009
0.444
+0.044
11.04%
jan 1, 2010
0.433
-0.011
-2.42%
jan 1, 2011
0.468
+0.035
8.1%
jan 1, 2012
0.506
+0.038
8.05%
jan 1, 2013
0.539
+0.033
6.53%
jan 1, 2014
0.547
+0.008
1.54%
Ranking of countries by current statistics by years


Comments: