29
/
en
AIzaSyAYiBZKx7MnpbEhh9jyipgxe19OcubqV5w
April 1, 2024
266641
Trinidad and Tobago
TTO
true
2
1
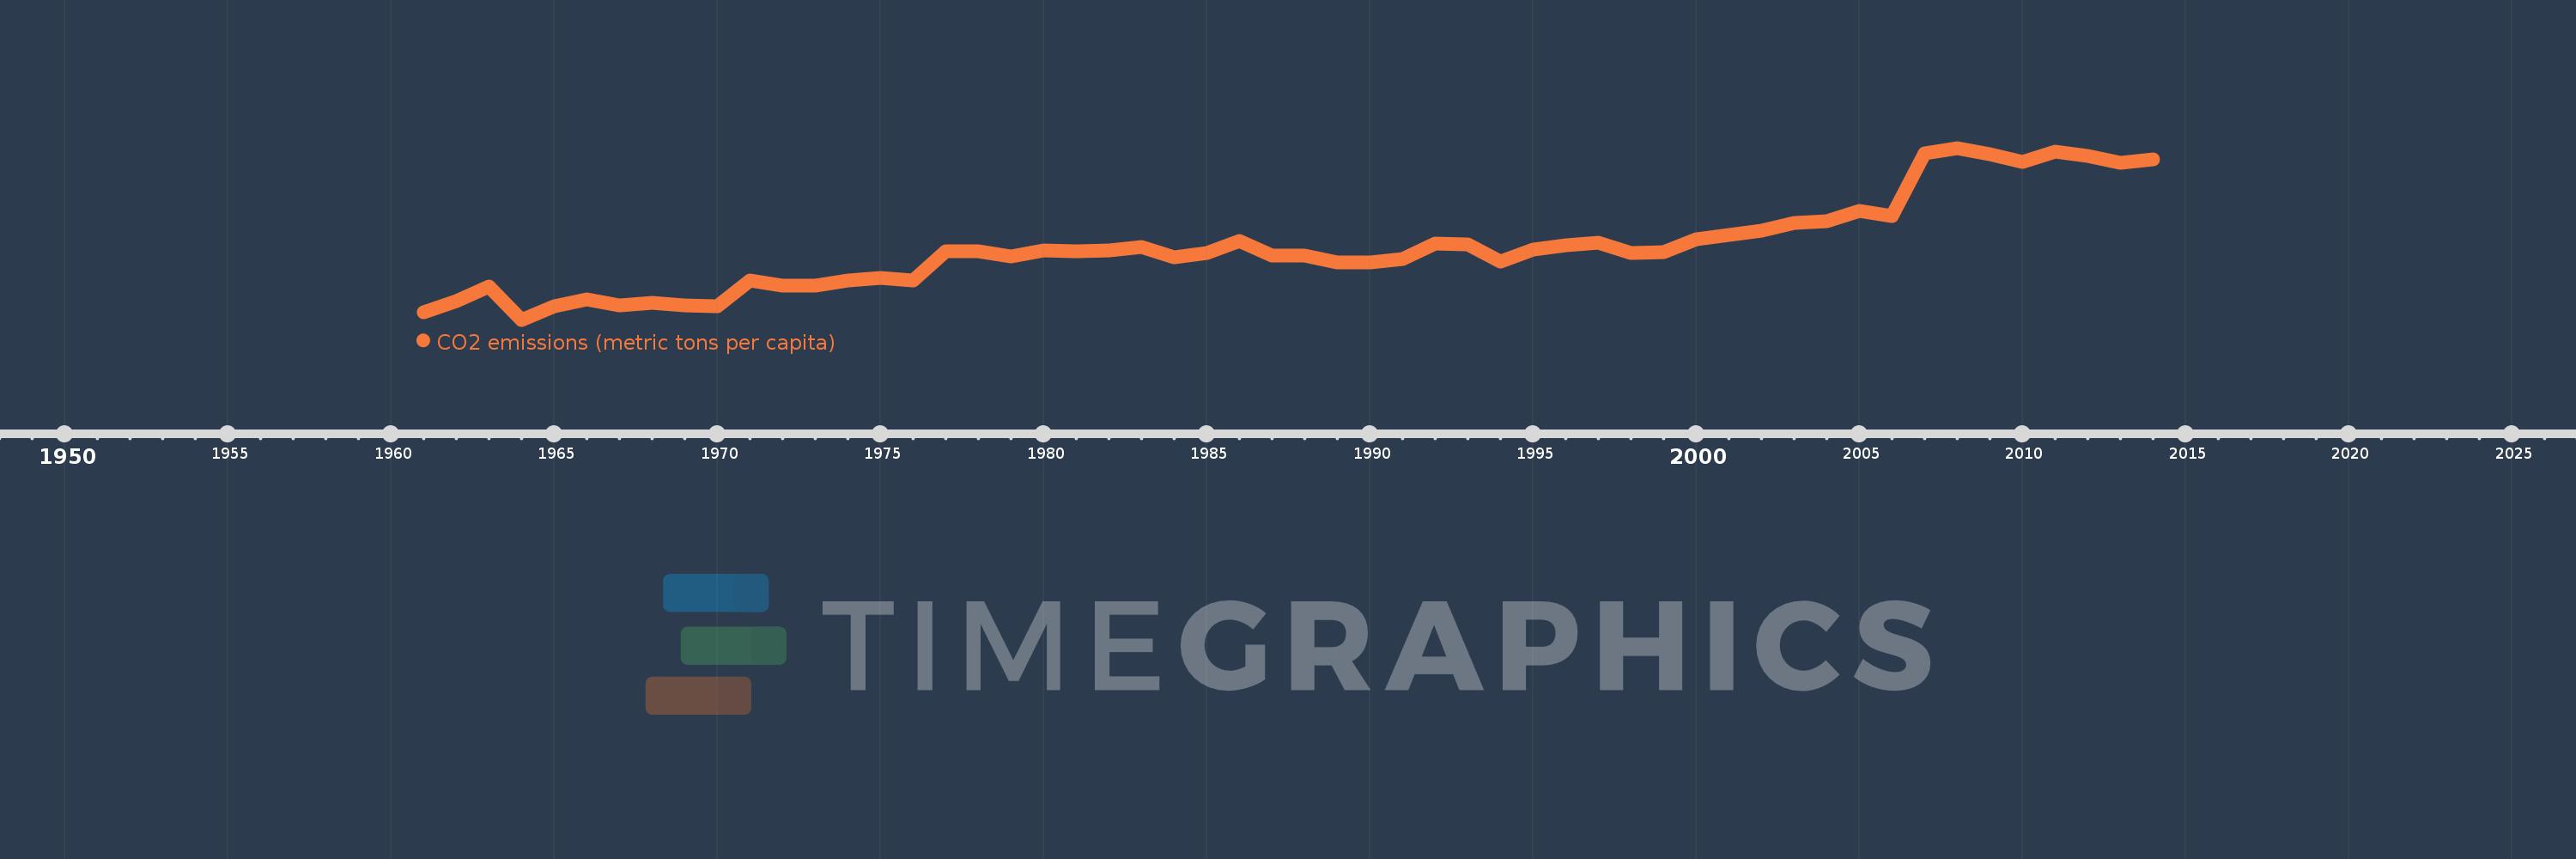
CO2 emissions (metric tons per capita)
2014,2013,2012,2011,2010,2009,2008,2007,2006,2005,2004,2003,2002,2001,2000,1999,1998,1997,1996,1995,1994,1993,1992,1991,1990,1989,1988,1987,1986,1985,1984,1983,1982,1981,1980,1979,1978,1977,1976,1975,1974,1973,1972,1971,1970,1969,1968,1967,1966,1965,1964,1963,1962,1961
This statistics in other country:
AfghanistanAlbaniaAlgeriaAndorraAngolaAntigua and BarbudaArab WorldArgentinaArmeniaArubaAustraliaAustriaAzerbaijanBahamas, TheBahrainBangladeshBarbadosBelarusBelgiumBelizeBeninBermudaBhutanBoliviaBosnia and HerzegovinaBotswanaBrazilBritish Virgin IslandsBrunei DarussalamBulgariaBurkina FasoBurundiCabo VerdeCambodiaCameroonCanadaCaribbean small statesCayman IslandsCentral African RepublicCentral Europe and the BalticsChadChileChinaColombiaComorosCongo, Dem. Rep.Congo, Rep.Costa RicaCote d'IvoireCroatiaCubaCuracaoCyprusCzech RepublicDenmarkDjiboutiDominicaDominican RepublicEarly-demographic dividendEast Asia & PacificEast Asia & Pacific (excluding high income)East Asia & Pacific (IDA & IBRD countries)EcuadorEgypt, Arab Rep.El SalvadorEquatorial GuineaEritreaEstoniaEthiopiaEuro areaEurope & Central AsiaEurope & Central Asia (excluding high income)Europe & Central Asia (IDA & IBRD countries)European UnionFaroe IslandsFijiFinlandFragile and conflict affected situationsFranceFrench PolynesiaGabonGambia, TheGeorgiaGermanyGhanaGibraltarGreeceGreenlandGrenadaGuatemalaGuineaGuinea-BissauGuyanaHaitiHeavily indebted poor countries (HIPC)High incomeHondurasHong Kong SAR, ChinaHungaryIBRD onlyIcelandIDA & IBRD totalIDA blendIDA onlyIDA totalIndiaIndonesiaIran, Islamic Rep.IraqIrelandIsraelItalyJamaicaJapanJordanKazakhstanKenyaKiribatiKorea, Dem. People’s Rep.Korea, Rep.KuwaitKyrgyz RepublicLao PDRLate-demographic dividendLatin America & Caribbean Latin America & Caribbean (excluding high income)Latin America & the Caribbean (IDA & IBRD countries)LatviaLeast developed countries: UN classificationLebanonLesothoLiberiaLibyaLiechtensteinLithuaniaLow & middle incomeLow incomeLower middle incomeLuxembourgMacao SAR, ChinaMacedonia, FYRMadagascarMalawiMalaysiaMaldivesMaliMaltaMarshall IslandsMauritaniaMauritiusMexicoMicronesia, Fed. Sts.Middle East & North AfricaMiddle East & North Africa (excluding high income)Middle East & North Africa (IDA & IBRD countries)Middle incomeMoldovaMongoliaMontenegroMoroccoMozambiqueMyanmarNamibiaNauruNepalNetherlandsNew CaledoniaNew ZealandNicaraguaNigerNigeriaNorth AmericaNorwayOECD membersOmanOther small statesPacific island small statesPakistanPalauPanamaPapua New GuineaParaguayPeruPhilippinesPolandPortugalPost-demographic dividendPre-demographic dividendQatarRomaniaRussian FederationRwandaSamoaSao Tome and PrincipeSaudi ArabiaSenegalSerbiaSeychellesSierra LeoneSingaporeSint Maarten (Dutch part)Slovak RepublicSloveniaSmall statesSolomon IslandsSomaliaSouth AfricaSouth AsiaSouth Asia (IDA & IBRD)South SudanSpainSri LankaSt. Kitts and NevisSt. LuciaSt. Vincent and the GrenadinesSub-Saharan Africa Sub-Saharan Africa (excluding high income)Sub-Saharan Africa (IDA & IBRD countries)SudanSurinameSwazilandSwedenSwitzerlandSyrian Arab RepublicTajikistanTanzaniaThailandTimor-LesteTogoTongaTrinidad and TobagoTunisiaTurkeyTurkmenistanTurks and Caicos IslandsUgandaUkraineUnited Arab EmiratesUnited KingdomUnited StatesUpper middle incomeUruguayUzbekistanVanuatuVenezuela, RBVietnamWest Bank and GazaWorldYemen, Rep.ZambiaZimbabwe Timeline:
This timeline shows a graph from 1961 to 2014 of Trinidad and Tobago. No data until 1960. Number of actual observations by date: 54.
Source name:
World Development Indicators
Source organization:
Carbon Dioxide Information Analysis Center, Environmental Sciences Division, Oak Ridge National Laboratory, Tennessee, United States.
Categories, topics:
Climate Change, Environment
Last updated:
apr 23, 2017
Indicators value changes by year
Maximum:
36.817
jan 1, 2008
At the date of observation
Value
Absolute change
Change from previous value
jan 1, 1961
3.043
+3.043
0.0%
jan 1, 1962
5.318
+2.276
74.79%
jan 1, 1963
8.226
+2.907
54.67%
jan 1, 1964
1.467
-6.759
-82.17%
jan 1, 1965
4.202
+2.735
186.48%
jan 1, 1966
5.695
+1.493
35.54%
jan 1, 1967
4.409
-1.286
-22.58%
jan 1, 1968
5.01
+0.601
13.63%
jan 1, 1969
4.338
-0.672
-13.4%
jan 1, 1970
4.164
-0.174
-4.01%
jan 1, 1971
9.513
+5.348
128.44%
jan 1, 1972
8.474
-1.039
-10.92%
jan 1, 1973
8.509
+0.036
0.42%
jan 1, 1974
9.565
+1.056
12.41%
jan 1, 1975
10.081
+0.516
5.39%
jan 1, 1976
9.513
-0.568
-5.63%
jan 1, 1977
15.527
+6.014
63.22%
jan 1, 1978
15.557
+0.029
0.19%
jan 1, 1979
14.541
-1.015
-6.53%
jan 1, 1980
15.643
+1.101
7.57%
jan 1, 1981
15.607
-0.036
-0.23%
jan 1, 1982
15.655
+0.048
0.31%
jan 1, 1983
16.443
+0.788
5.04%
jan 1, 1984
14.318
-2.125
-12.93%
jan 1, 1985
15.173
+0.855
5.97%
jan 1, 1986
17.725
+2.552
16.82%
jan 1, 1987
14.683
-3.043
-17.16%
jan 1, 1988
14.659
-0.024
-0.16%
jan 1, 1989
13.169
-1.49
-10.16%
jan 1, 1990
13.301
+0.132
1.0%
jan 1, 1991
13.88
+0.579
4.35%
jan 1, 1992
17.114
+3.234
23.3%
jan 1, 1993
16.959
-0.155
-0.91%
jan 1, 1994
13.517
-3.442
-20.3%
jan 1, 1995
15.878
+2.362
17.47%
jan 1, 1996
16.707
+0.829
5.22%
jan 1, 1997
17.31
+0.602
3.6%
jan 1, 1998
15.254
-2.056
-11.88%
jan 1, 1999
15.301
+0.047
0.31%
jan 1, 2000
18.04
+2.739
17.9%
jan 1, 2001
18.844
+0.805
4.46%
jan 1, 2002
19.762
+0.918
4.87%
jan 1, 2003
21.305
+1.543
7.81%
jan 1, 2004
21.73
+0.425
2.0%
jan 1, 2005
23.877
+2.147
9.88%
jan 1, 2006
22.755
-1.122
-4.7%
jan 1, 2007
35.63
+12.875
56.58%
jan 1, 2008
36.817
+1.186
3.33%
jan 1, 2009
35.455
-1.361
-3.7%
jan 1, 2010
33.953
-1.502
-4.24%
jan 1, 2011
36.074
+2.121
6.25%
jan 1, 2012
35.137
-0.936
-2.6%
jan 1, 2013
33.82
-1.318
-3.75%
jan 1, 2014
34.52
+0.701
2.07%
Ranking of countries by current statistics by years


Comments: