29
/
en
AIzaSyAYiBZKx7MnpbEhh9jyipgxe19OcubqV5w
April 1, 2024
193975
Mauritius
MUS
true
2
1
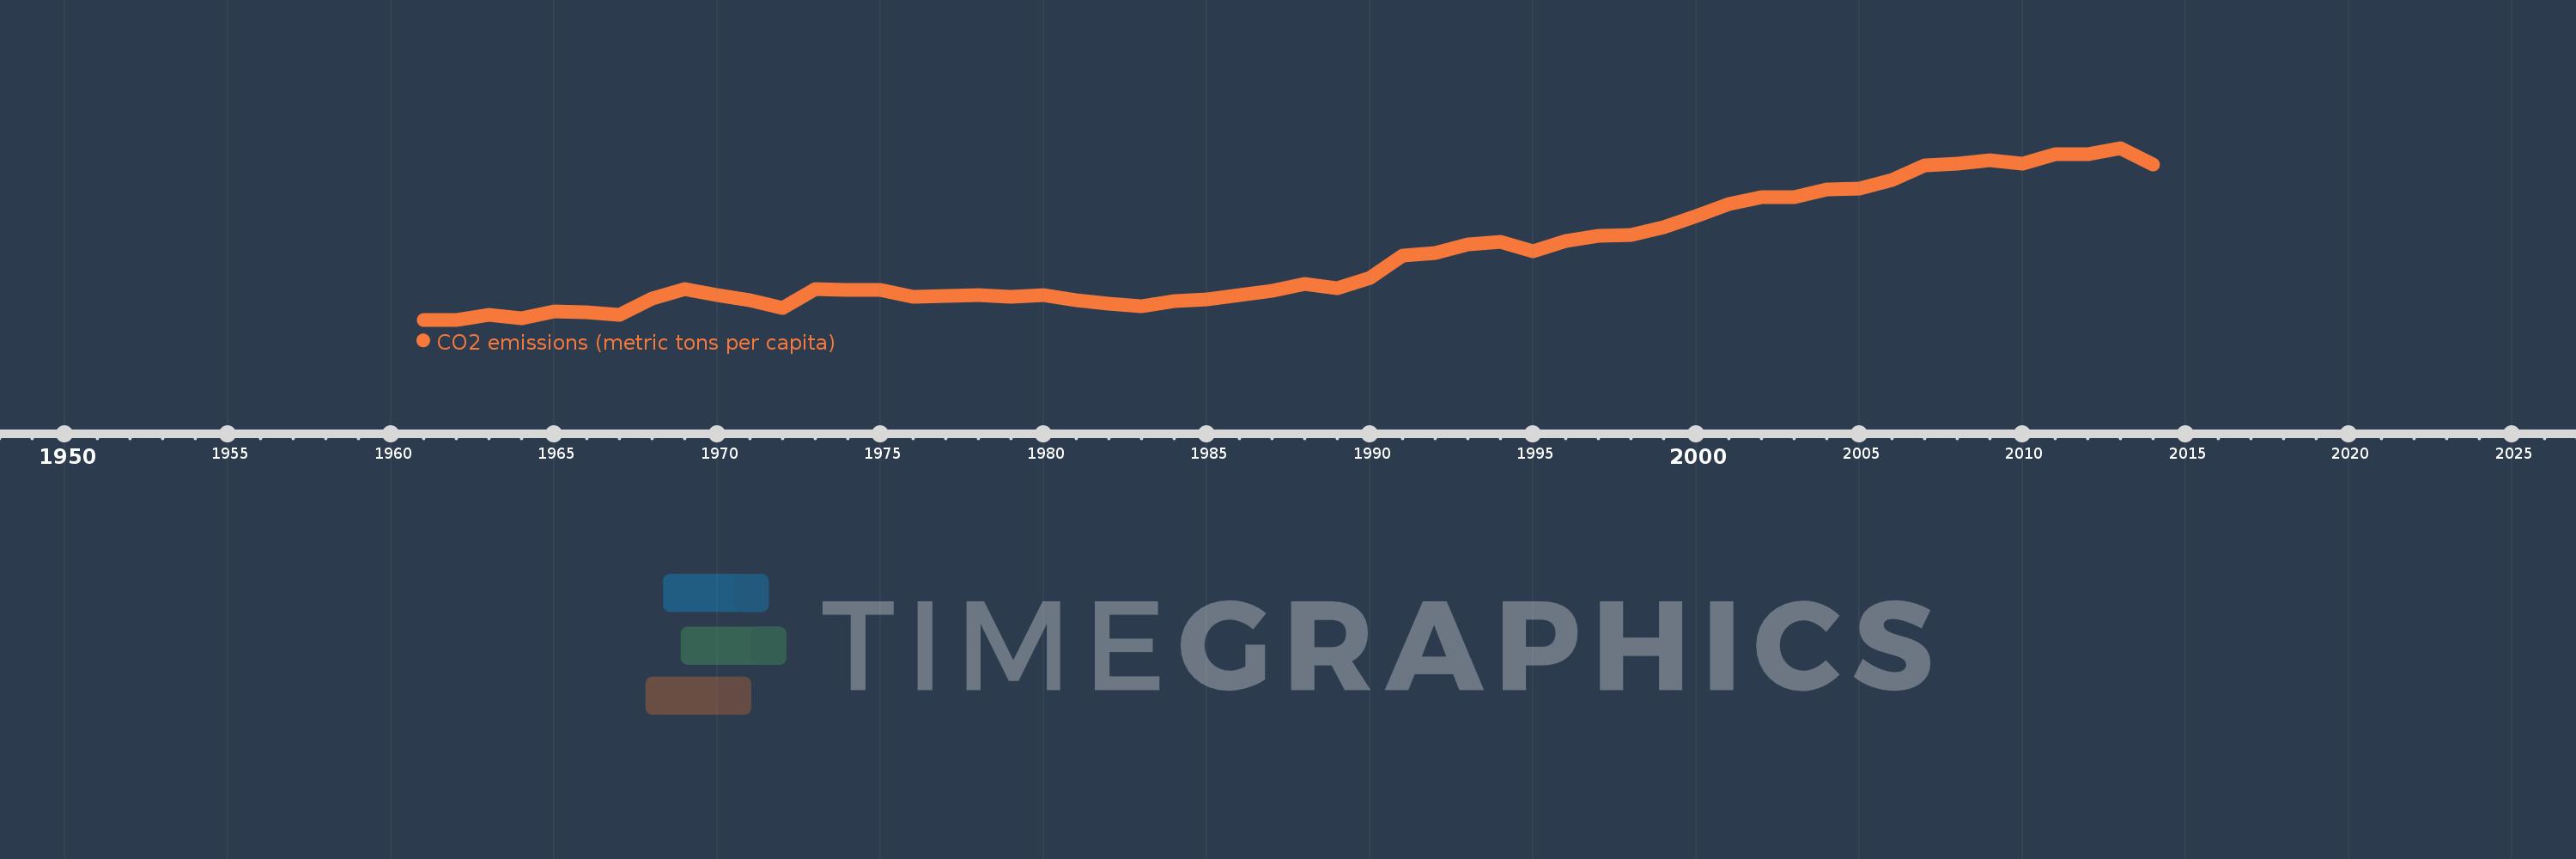
CO2 emissions (metric tons per capita)
2014,2013,2012,2011,2010,2009,2008,2007,2006,2005,2004,2003,2002,2001,2000,1999,1998,1997,1996,1995,1994,1993,1992,1991,1990,1989,1988,1987,1986,1985,1984,1983,1982,1981,1980,1979,1978,1977,1976,1975,1974,1973,1972,1971,1970,1969,1968,1967,1966,1965,1964,1963,1962,1961
This statistics in other country:
AfghanistanAlbaniaAlgeriaAndorraAngolaAntigua and BarbudaArab WorldArgentinaArmeniaArubaAustraliaAustriaAzerbaijanBahamas, TheBahrainBangladeshBarbadosBelarusBelgiumBelizeBeninBermudaBhutanBoliviaBosnia and HerzegovinaBotswanaBrazilBritish Virgin IslandsBrunei DarussalamBulgariaBurkina FasoBurundiCabo VerdeCambodiaCameroonCanadaCaribbean small statesCayman IslandsCentral African RepublicCentral Europe and the BalticsChadChileChinaColombiaComorosCongo, Dem. Rep.Congo, Rep.Costa RicaCote d'IvoireCroatiaCubaCuracaoCyprusCzech RepublicDenmarkDjiboutiDominicaDominican RepublicEarly-demographic dividendEast Asia & PacificEast Asia & Pacific (excluding high income)East Asia & Pacific (IDA & IBRD countries)EcuadorEgypt, Arab Rep.El SalvadorEquatorial GuineaEritreaEstoniaEthiopiaEuro areaEurope & Central AsiaEurope & Central Asia (excluding high income)Europe & Central Asia (IDA & IBRD countries)European UnionFaroe IslandsFijiFinlandFragile and conflict affected situationsFranceFrench PolynesiaGabonGambia, TheGeorgiaGermanyGhanaGibraltarGreeceGreenlandGrenadaGuatemalaGuineaGuinea-BissauGuyanaHaitiHeavily indebted poor countries (HIPC)High incomeHondurasHong Kong SAR, ChinaHungaryIBRD onlyIcelandIDA & IBRD totalIDA blendIDA onlyIDA totalIndiaIndonesiaIran, Islamic Rep.IraqIrelandIsraelItalyJamaicaJapanJordanKazakhstanKenyaKiribatiKorea, Dem. People’s Rep.Korea, Rep.KuwaitKyrgyz RepublicLao PDRLate-demographic dividendLatin America & Caribbean Latin America & Caribbean (excluding high income)Latin America & the Caribbean (IDA & IBRD countries)LatviaLeast developed countries: UN classificationLebanonLesothoLiberiaLibyaLiechtensteinLithuaniaLow & middle incomeLow incomeLower middle incomeLuxembourgMacao SAR, ChinaMacedonia, FYRMadagascarMalawiMalaysiaMaldivesMaliMaltaMarshall IslandsMauritaniaMauritiusMexicoMicronesia, Fed. Sts.Middle East & North AfricaMiddle East & North Africa (excluding high income)Middle East & North Africa (IDA & IBRD countries)Middle incomeMoldovaMongoliaMontenegroMoroccoMozambiqueMyanmarNamibiaNauruNepalNetherlandsNew CaledoniaNew ZealandNicaraguaNigerNigeriaNorth AmericaNorwayOECD membersOmanOther small statesPacific island small statesPakistanPalauPanamaPapua New GuineaParaguayPeruPhilippinesPolandPortugalPost-demographic dividendPre-demographic dividendQatarRomaniaRussian FederationRwandaSamoaSao Tome and PrincipeSaudi ArabiaSenegalSerbiaSeychellesSierra LeoneSingaporeSint Maarten (Dutch part)Slovak RepublicSloveniaSmall statesSolomon IslandsSomaliaSouth AfricaSouth AsiaSouth Asia (IDA & IBRD)South SudanSpainSri LankaSt. Kitts and NevisSt. LuciaSt. Vincent and the GrenadinesSub-Saharan Africa Sub-Saharan Africa (excluding high income)Sub-Saharan Africa (IDA & IBRD countries)SudanSurinameSwazilandSwedenSwitzerlandSyrian Arab RepublicTajikistanTanzaniaThailandTimor-LesteTogoTongaTrinidad and TobagoTunisiaTurkeyTurkmenistanTurks and Caicos IslandsUgandaUkraineUnited Arab EmiratesUnited KingdomUnited StatesUpper middle incomeUruguayUzbekistanVanuatuVenezuela, RBVietnamWest Bank and GazaWorldYemen, Rep.ZambiaZimbabwe Timeline:
This timeline shows a graph from 1961 to 2014 of Mauritius. No data until 1960. Number of actual observations by date: 54.
Source name:
World Development Indicators
Source organization:
Carbon Dioxide Information Analysis Center, Environmental Sciences Division, Oak Ridge National Laboratory, Tennessee, United States.
Categories, topics:
Climate Change, Environment
Last updated:
apr 23, 2017
Indicators value changes by year
At the date of observation
Value
Absolute change
Change from previous value
jan 1, 1961
0.273
+0.273
0.0%
jan 1, 1962
0.275
+0.002
0.81%
jan 1, 1963
0.361
+0.087
31.51%
jan 1, 1964
0.291
-0.071
-19.52%
jan 1, 1965
0.418
+0.128
43.86%
jan 1, 1966
0.404
-0.014
-3.37%
jan 1, 1967
0.358
-0.046
-11.5%
jan 1, 1968
0.636
+0.278
77.84%
jan 1, 1969
0.799
+0.163
25.62%
jan 1, 1970
0.704
-0.095
-11.89%
jan 1, 1971
0.604
-0.1
-14.26%
jan 1, 1972
0.472
-0.132
-21.84%
jan 1, 1973
0.809
+0.337
71.45%
jan 1, 1974
0.784
-0.025
-3.05%
jan 1, 1975
0.789
+0.005
0.62%
jan 1, 1976
0.662
-0.127
-16.15%
jan 1, 1977
0.684
+0.022
3.29%
jan 1, 1978
0.696
+0.013
1.88%
jan 1, 1979
0.676
-0.021
-2.99%
jan 1, 1980
0.695
+0.019
2.85%
jan 1, 1981
0.611
-0.084
-12.05%
jan 1, 1982
0.554
-0.058
-9.43%
jan 1, 1983
0.506
-0.047
-8.56%
jan 1, 1984
0.597
+0.091
17.89%
jan 1, 1985
0.619
+0.023
3.82%
jan 1, 1986
0.693
+0.074
11.95%
jan 1, 1987
0.777
+0.084
12.09%
jan 1, 1988
0.899
+0.122
15.65%
jan 1, 1989
0.819
-0.08
-8.9%
jan 1, 1990
1.001
+0.182
22.24%
jan 1, 1991
1.382
+0.381
38.04%
jan 1, 1992
1.422
+0.04
2.89%
jan 1, 1993
1.576
+0.154
10.82%
jan 1, 1994
1.617
+0.042
2.64%
jan 1, 1995
1.46
-0.158
-9.74%
jan 1, 1996
1.63
+0.17
11.68%
jan 1, 1997
1.72
+0.09
5.53%
jan 1, 1998
1.74
+0.02
1.17%
jan 1, 1999
1.871
+0.13
7.49%
jan 1, 2000
2.066
+0.195
10.41%
jan 1, 2001
2.268
+0.202
9.79%
jan 1, 2002
2.394
+0.126
5.57%
jan 1, 2003
2.396
+0.002
0.07%
jan 1, 2004
2.524
+0.128
5.33%
jan 1, 2005
2.532
+0.008
0.33%
jan 1, 2006
2.684
+0.152
6.01%
jan 1, 2007
2.942
+0.258
9.61%
jan 1, 2008
2.976
+0.034
1.15%
jan 1, 2009
3.03
+0.054
1.82%
jan 1, 2010
2.963
-0.067
-2.21%
jan 1, 2011
3.132
+0.169
5.7%
jan 1, 2012
3.13
-0.002
-0.07%
jan 1, 2013
3.241
+0.111
3.55%
jan 1, 2014
2.96
-0.281
-8.67%
Ranking of countries by current statistics by years


Comments: