29
/
en
AIzaSyAYiBZKx7MnpbEhh9jyipgxe19OcubqV5w
April 1, 2024
253944
Suriname
SUR
true
2
1
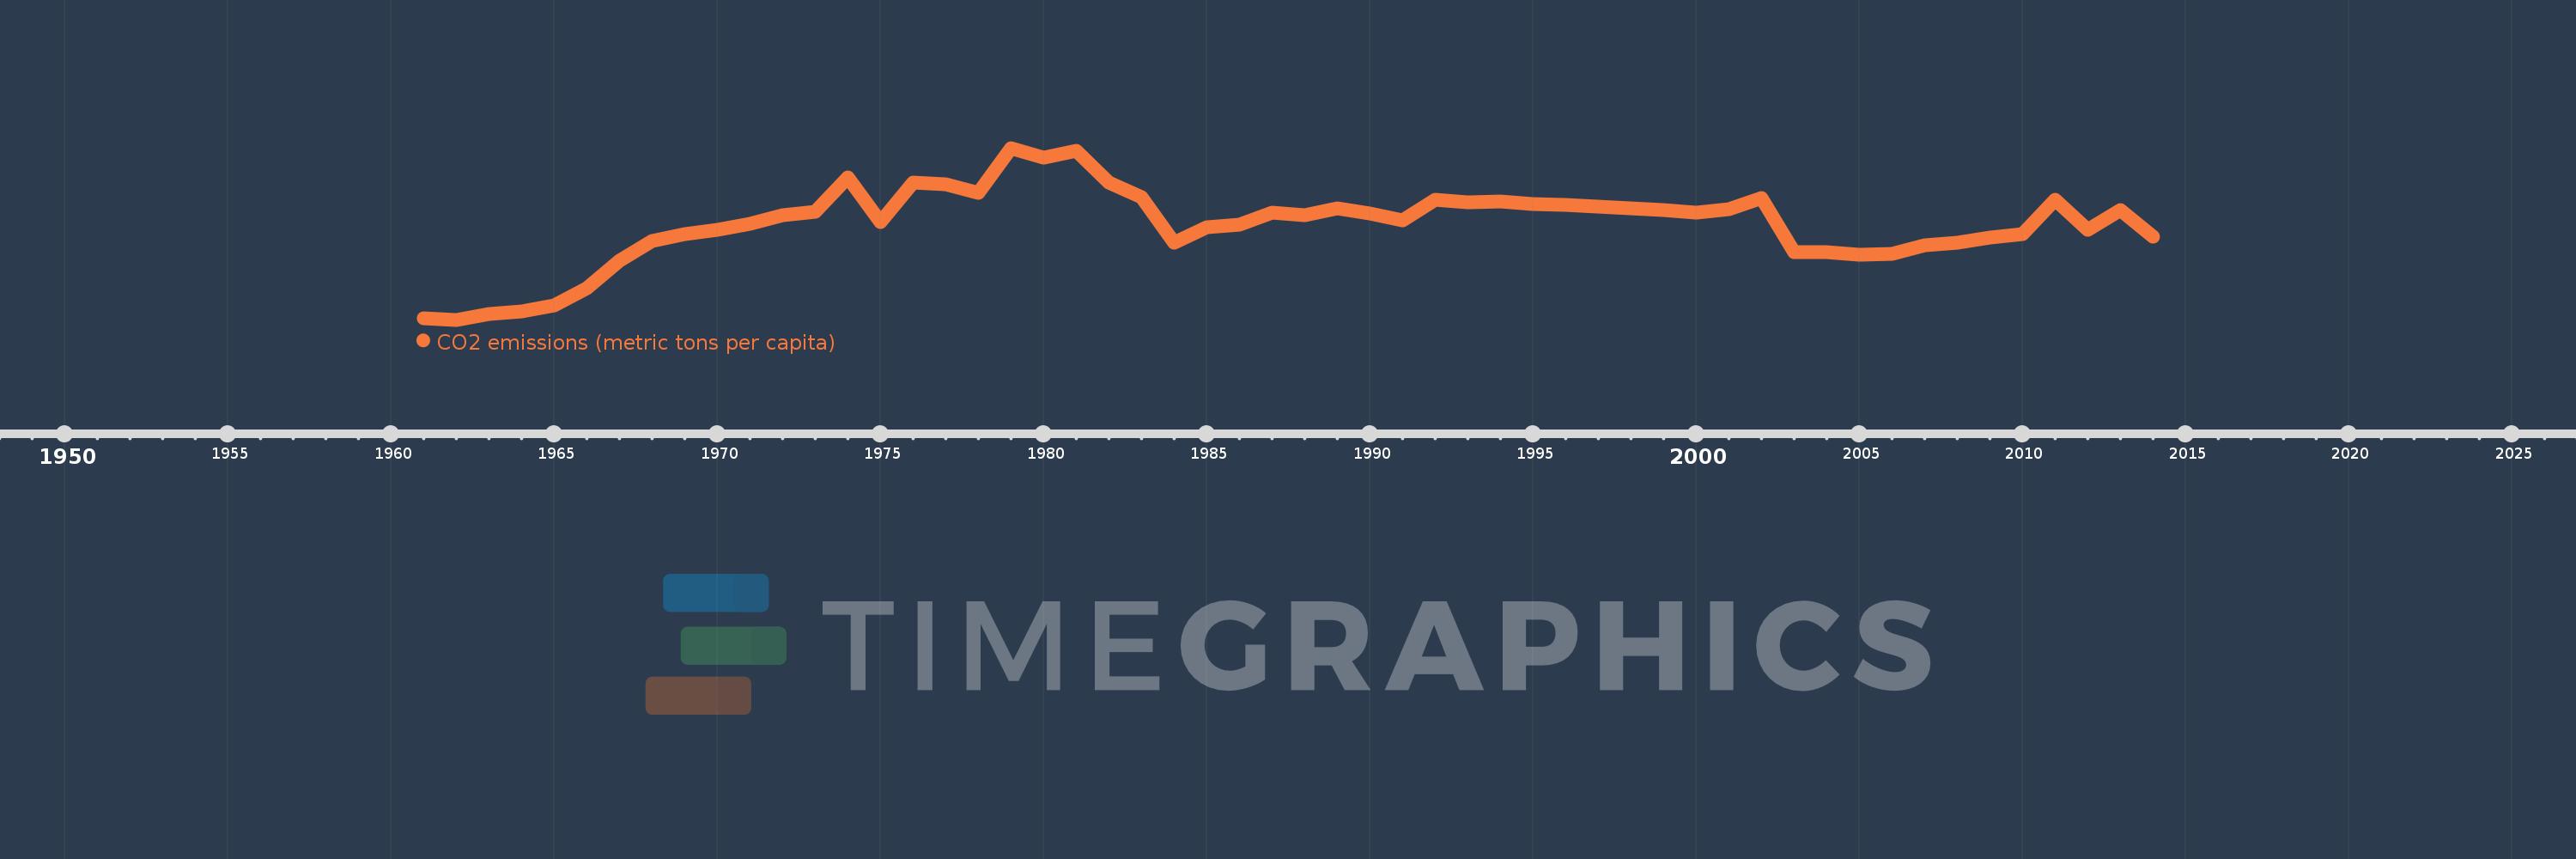
CO2 emissions (metric tons per capita)
2014,2013,2012,2011,2010,2009,2008,2007,2006,2005,2004,2003,2002,2001,2000,1999,1998,1997,1996,1995,1994,1993,1992,1991,1990,1989,1988,1987,1986,1985,1984,1983,1982,1981,1980,1979,1978,1977,1976,1975,1974,1973,1972,1971,1970,1969,1968,1967,1966,1965,1964,1963,1962,1961
This statistics in other country:
AfghanistanAlbaniaAlgeriaAndorraAngolaAntigua and BarbudaArab WorldArgentinaArmeniaArubaAustraliaAustriaAzerbaijanBahamas, TheBahrainBangladeshBarbadosBelarusBelgiumBelizeBeninBermudaBhutanBoliviaBosnia and HerzegovinaBotswanaBrazilBritish Virgin IslandsBrunei DarussalamBulgariaBurkina FasoBurundiCabo VerdeCambodiaCameroonCanadaCaribbean small statesCayman IslandsCentral African RepublicCentral Europe and the BalticsChadChileChinaColombiaComorosCongo, Dem. Rep.Congo, Rep.Costa RicaCote d'IvoireCroatiaCubaCuracaoCyprusCzech RepublicDenmarkDjiboutiDominicaDominican RepublicEarly-demographic dividendEast Asia & PacificEast Asia & Pacific (excluding high income)East Asia & Pacific (IDA & IBRD countries)EcuadorEgypt, Arab Rep.El SalvadorEquatorial GuineaEritreaEstoniaEthiopiaEuro areaEurope & Central AsiaEurope & Central Asia (excluding high income)Europe & Central Asia (IDA & IBRD countries)European UnionFaroe IslandsFijiFinlandFragile and conflict affected situationsFranceFrench PolynesiaGabonGambia, TheGeorgiaGermanyGhanaGibraltarGreeceGreenlandGrenadaGuatemalaGuineaGuinea-BissauGuyanaHaitiHeavily indebted poor countries (HIPC)High incomeHondurasHong Kong SAR, ChinaHungaryIBRD onlyIcelandIDA & IBRD totalIDA blendIDA onlyIDA totalIndiaIndonesiaIran, Islamic Rep.IraqIrelandIsraelItalyJamaicaJapanJordanKazakhstanKenyaKiribatiKorea, Dem. People’s Rep.Korea, Rep.KuwaitKyrgyz RepublicLao PDRLate-demographic dividendLatin America & Caribbean Latin America & Caribbean (excluding high income)Latin America & the Caribbean (IDA & IBRD countries)LatviaLeast developed countries: UN classificationLebanonLesothoLiberiaLibyaLiechtensteinLithuaniaLow & middle incomeLow incomeLower middle incomeLuxembourgMacao SAR, ChinaMacedonia, FYRMadagascarMalawiMalaysiaMaldivesMaliMaltaMarshall IslandsMauritaniaMauritiusMexicoMicronesia, Fed. Sts.Middle East & North AfricaMiddle East & North Africa (excluding high income)Middle East & North Africa (IDA & IBRD countries)Middle incomeMoldovaMongoliaMontenegroMoroccoMozambiqueMyanmarNamibiaNauruNepalNetherlandsNew CaledoniaNew ZealandNicaraguaNigerNigeriaNorth AmericaNorwayOECD membersOmanOther small statesPacific island small statesPakistanPalauPanamaPapua New GuineaParaguayPeruPhilippinesPolandPortugalPost-demographic dividendPre-demographic dividendQatarRomaniaRussian FederationRwandaSamoaSao Tome and PrincipeSaudi ArabiaSenegalSerbiaSeychellesSierra LeoneSingaporeSint Maarten (Dutch part)Slovak RepublicSloveniaSmall statesSolomon IslandsSomaliaSouth AfricaSouth AsiaSouth Asia (IDA & IBRD)South SudanSpainSri LankaSt. Kitts and NevisSt. LuciaSt. Vincent and the GrenadinesSub-Saharan Africa Sub-Saharan Africa (excluding high income)Sub-Saharan Africa (IDA & IBRD countries)SudanSurinameSwazilandSwedenSwitzerlandSyrian Arab RepublicTajikistanTanzaniaThailandTimor-LesteTogoTongaTrinidad and TobagoTunisiaTurkeyTurkmenistanTurks and Caicos IslandsUgandaUkraineUnited Arab EmiratesUnited KingdomUnited StatesUpper middle incomeUruguayUzbekistanVanuatuVenezuela, RBVietnamWest Bank and GazaWorldYemen, Rep.ZambiaZimbabwe Timeline:
This timeline shows a graph from 1961 to 2014 of Suriname. No data until 1960. Number of actual observations by date: 54.
Source name:
World Development Indicators
Source organization:
Carbon Dioxide Information Analysis Center, Environmental Sciences Division, Oak Ridge National Laboratory, Tennessee, United States.
Categories, topics:
Climate Change, Environment
Last updated:
apr 23, 2017
Indicators value changes by year
At the date of observation
Value
Absolute change
Change from previous value
jan 1, 1961
1.492
+1.492
0.0%
jan 1, 1962
1.439
-0.053
-3.58%
jan 1, 1963
1.616
+0.177
12.32%
jan 1, 1964
1.691
+0.074
4.61%
jan 1, 1965
1.873
+0.183
10.81%
jan 1, 1966
2.398
+0.525
28.03%
jan 1, 1967
3.214
+0.816
34.02%
jan 1, 1968
3.805
+0.591
18.4%
jan 1, 1969
4.037
+0.231
6.08%
jan 1, 1970
4.148
+0.112
2.77%
jan 1, 1971
4.336
+0.188
4.52%
jan 1, 1972
4.606
+0.27
6.22%
jan 1, 1973
4.701
+0.095
2.07%
jan 1, 1974
5.724
+1.024
21.77%
jan 1, 1975
4.389
-1.335
-23.33%
jan 1, 1976
5.572
+1.182
26.94%
jan 1, 1977
5.53
-0.041
-0.74%
jan 1, 1978
5.261
-0.269
-4.87%
jan 1, 1979
6.625
+1.364
25.92%
jan 1, 1980
6.339
-0.286
-4.31%
jan 1, 1981
6.54
+0.201
3.17%
jan 1, 1982
5.592
-0.948
-14.5%
jan 1, 1983
5.148
-0.444
-7.94%
jan 1, 1984
3.765
-1.383
-26.87%
jan 1, 1985
4.229
+0.465
12.34%
jan 1, 1986
4.304
+0.075
1.76%
jan 1, 1987
4.669
+0.365
8.48%
jan 1, 1988
4.585
-0.084
-1.81%
jan 1, 1989
4.791
+0.207
4.51%
jan 1, 1990
4.637
-0.154
-3.22%
jan 1, 1991
4.437
-0.2
-4.32%
jan 1, 1992
5.05
+0.613
13.82%
jan 1, 1993
4.987
-0.063
-1.26%
jan 1, 1994
5.004
+0.017
0.35%
jan 1, 1995
4.936
-0.068
-1.35%
jan 1, 1996
4.894
-0.042
-0.86%
jan 1, 1997
4.858
-0.036
-0.73%
jan 1, 1998
4.799
-0.059
-1.22%
jan 1, 1999
4.753
-0.046
-0.96%
jan 1, 2000
4.68
-0.073
-1.53%
jan 1, 2001
4.783
+0.103
2.2%
jan 1, 2002
5.104
+0.322
6.73%
jan 1, 2003
3.476
-1.628
-31.89%
jan 1, 2004
3.467
-0.01
-0.28%
jan 1, 2005
3.41
-0.057
-1.64%
jan 1, 2006
3.429
+0.019
0.55%
jan 1, 2007
3.675
+0.246
7.18%
jan 1, 2008
3.77
+0.095
2.59%
jan 1, 2009
3.916
+0.146
3.87%
jan 1, 2010
4.021
+0.105
2.69%
jan 1, 2011
5.067
+1.046
26.02%
jan 1, 2012
4.147
-0.92
-18.16%
jan 1, 2013
4.746
+0.598
14.43%
jan 1, 2014
3.939
-0.807
-17.0%
Ranking of countries by current statistics by years


Comments: