29
/
en
AIzaSyAYiBZKx7MnpbEhh9jyipgxe19OcubqV5w
April 1, 2024
142500
Greenland
GRL
true
2
1
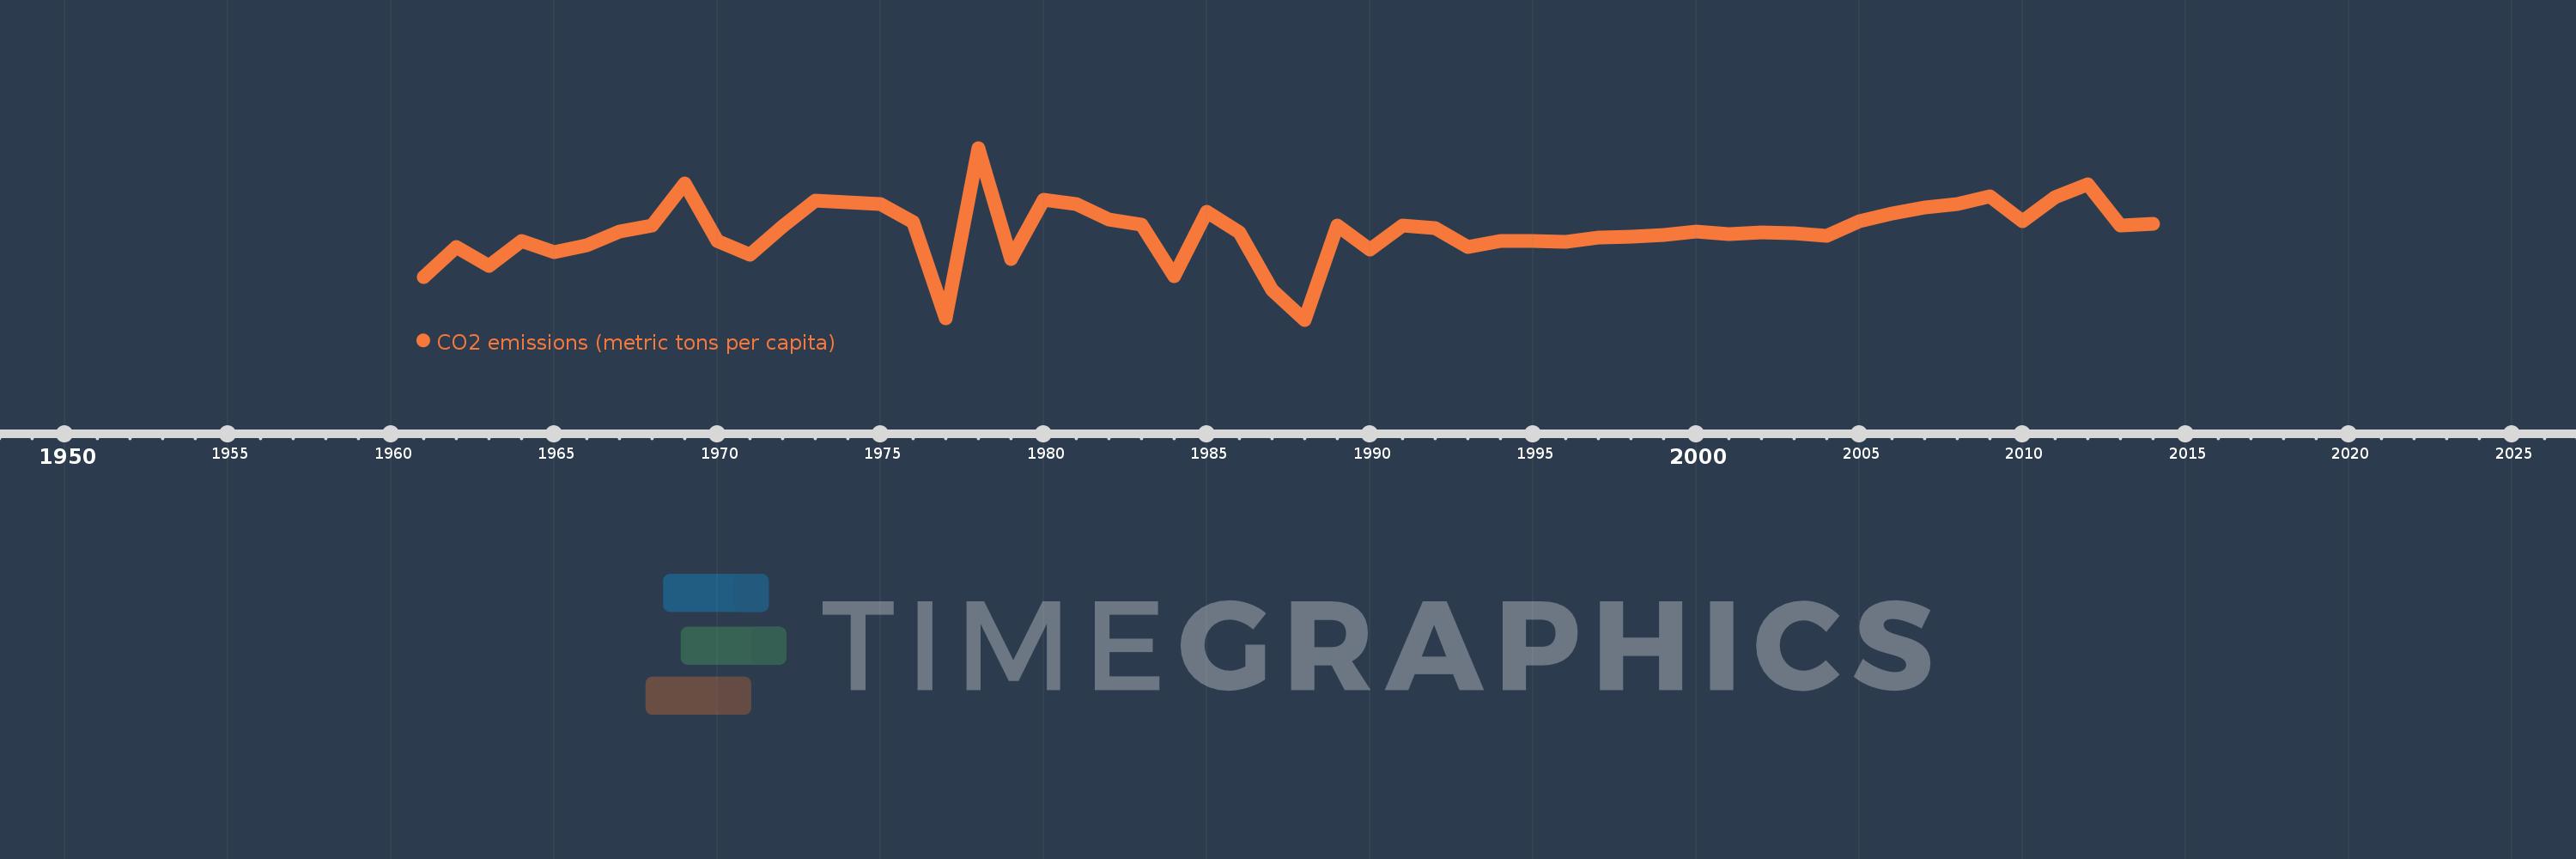
CO2 emissions (metric tons per capita)
2014,2013,2012,2011,2010,2009,2008,2007,2006,2005,2004,2003,2002,2001,2000,1999,1998,1997,1996,1995,1994,1993,1992,1991,1990,1989,1988,1987,1986,1985,1984,1983,1982,1981,1980,1979,1978,1977,1976,1975,1974,1973,1972,1971,1970,1969,1968,1967,1966,1965,1964,1963,1962,1961
This statistics in other country:
AfghanistanAlbaniaAlgeriaAndorraAngolaAntigua and BarbudaArab WorldArgentinaArmeniaArubaAustraliaAustriaAzerbaijanBahamas, TheBahrainBangladeshBarbadosBelarusBelgiumBelizeBeninBermudaBhutanBoliviaBosnia and HerzegovinaBotswanaBrazilBritish Virgin IslandsBrunei DarussalamBulgariaBurkina FasoBurundiCabo VerdeCambodiaCameroonCanadaCaribbean small statesCayman IslandsCentral African RepublicCentral Europe and the BalticsChadChileChinaColombiaComorosCongo, Dem. Rep.Congo, Rep.Costa RicaCote d'IvoireCroatiaCubaCuracaoCyprusCzech RepublicDenmarkDjiboutiDominicaDominican RepublicEarly-demographic dividendEast Asia & PacificEast Asia & Pacific (excluding high income)East Asia & Pacific (IDA & IBRD countries)EcuadorEgypt, Arab Rep.El SalvadorEquatorial GuineaEritreaEstoniaEthiopiaEuro areaEurope & Central AsiaEurope & Central Asia (excluding high income)Europe & Central Asia (IDA & IBRD countries)European UnionFaroe IslandsFijiFinlandFragile and conflict affected situationsFranceFrench PolynesiaGabonGambia, TheGeorgiaGermanyGhanaGibraltarGreeceGreenlandGrenadaGuatemalaGuineaGuinea-BissauGuyanaHaitiHeavily indebted poor countries (HIPC)High incomeHondurasHong Kong SAR, ChinaHungaryIBRD onlyIcelandIDA & IBRD totalIDA blendIDA onlyIDA totalIndiaIndonesiaIran, Islamic Rep.IraqIrelandIsraelItalyJamaicaJapanJordanKazakhstanKenyaKiribatiKorea, Dem. People’s Rep.Korea, Rep.KuwaitKyrgyz RepublicLao PDRLate-demographic dividendLatin America & Caribbean Latin America & Caribbean (excluding high income)Latin America & the Caribbean (IDA & IBRD countries)LatviaLeast developed countries: UN classificationLebanonLesothoLiberiaLibyaLiechtensteinLithuaniaLow & middle incomeLow incomeLower middle incomeLuxembourgMacao SAR, ChinaMacedonia, FYRMadagascarMalawiMalaysiaMaldivesMaliMaltaMarshall IslandsMauritaniaMauritiusMexicoMicronesia, Fed. Sts.Middle East & North AfricaMiddle East & North Africa (excluding high income)Middle East & North Africa (IDA & IBRD countries)Middle incomeMoldovaMongoliaMontenegroMoroccoMozambiqueMyanmarNamibiaNauruNepalNetherlandsNew CaledoniaNew ZealandNicaraguaNigerNigeriaNorth AmericaNorwayOECD membersOmanOther small statesPacific island small statesPakistanPalauPanamaPapua New GuineaParaguayPeruPhilippinesPolandPortugalPost-demographic dividendPre-demographic dividendQatarRomaniaRussian FederationRwandaSamoaSao Tome and PrincipeSaudi ArabiaSenegalSerbiaSeychellesSierra LeoneSingaporeSint Maarten (Dutch part)Slovak RepublicSloveniaSmall statesSolomon IslandsSomaliaSouth AfricaSouth AsiaSouth Asia (IDA & IBRD)South SudanSpainSri LankaSt. Kitts and NevisSt. LuciaSt. Vincent and the GrenadinesSub-Saharan Africa Sub-Saharan Africa (excluding high income)Sub-Saharan Africa (IDA & IBRD countries)SudanSurinameSwazilandSwedenSwitzerlandSyrian Arab RepublicTajikistanTanzaniaThailandTimor-LesteTogoTongaTrinidad and TobagoTunisiaTurkeyTurkmenistanTurks and Caicos IslandsUgandaUkraineUnited Arab EmiratesUnited KingdomUnited StatesUpper middle incomeUruguayUzbekistanVanuatuVenezuela, RBVietnamWest Bank and GazaWorldYemen, Rep.ZambiaZimbabwe Timeline:
This timeline shows a graph from 1961 to 2014 of Greenland. No data until 1960. Number of actual observations by date: 54.
Source name:
World Development Indicators
Source organization:
Carbon Dioxide Information Analysis Center, Environmental Sciences Division, Oak Ridge National Laboratory, Tennessee, United States.
Categories, topics:
Climate Change, Environment
Last updated:
apr 23, 2017
Indicators value changes by year
Maximum:
14.623
jan 1, 1978
At the date of observation
Value
Absolute change
Change from previous value
jan 1, 1961
6.883
+6.883
0.0%
jan 1, 1962
8.705
+1.822
26.48%
jan 1, 1963
7.544
-1.162
-13.34%
jan 1, 1964
9.067
+1.523
20.19%
jan 1, 1965
8.387
-0.679
-7.49%
jan 1, 1966
8.793
+0.406
4.84%
jan 1, 1967
9.598
+0.804
9.15%
jan 1, 1968
9.977
+0.379
3.95%
jan 1, 1969
12.505
+2.528
25.34%
jan 1, 1970
9.065
-3.44
-27.51%
jan 1, 1971
8.219
-0.846
-9.34%
jan 1, 1972
9.944
+1.725
20.99%
jan 1, 1973
11.464
+1.52
15.28%
jan 1, 1974
11.375
-0.089
-0.78%
jan 1, 1975
11.26
-0.115
-1.01%
jan 1, 1976
10.203
-1.058
-9.39%
jan 1, 1977
4.427
-5.776
-56.61%
jan 1, 1978
14.623
+10.196
230.33%
jan 1, 1979
7.975
-6.648
-45.46%
jan 1, 1980
11.533
+3.558
44.62%
jan 1, 1981
11.249
-0.284
-2.46%
jan 1, 1982
10.354
-0.895
-7.96%
jan 1, 1983
10.04
-0.314
-3.03%
jan 1, 1984
6.968
-3.072
-30.6%
jan 1, 1985
10.785
+3.817
54.78%
jan 1, 1986
9.581
-1.204
-11.17%
jan 1, 1987
6.1
-3.481
-36.33%
jan 1, 1988
4.338
-1.762
-28.89%
jan 1, 1989
9.97
+5.632
129.84%
jan 1, 1990
8.554
-1.416
-14.21%
jan 1, 1991
9.959
+1.405
16.42%
jan 1, 1992
9.845
-0.114
-1.15%
jan 1, 1993
8.687
-1.158
-11.76%
jan 1, 1994
9.035
+0.348
4.0%
jan 1, 1995
9.052
+0.017
0.19%
jan 1, 1996
9.003
-0.049
-0.54%
jan 1, 1997
9.249
+0.246
2.74%
jan 1, 1998
9.298
+0.049
0.53%
jan 1, 1999
9.413
+0.114
1.23%
jan 1, 2000
9.609
+0.196
2.08%
jan 1, 2001
9.461
-0.148
-1.54%
jan 1, 2002
9.566
+0.105
1.11%
jan 1, 2003
9.522
-0.044
-0.46%
jan 1, 2004
9.367
-0.155
-1.63%
jan 1, 2005
10.245
+0.878
9.37%
jan 1, 2006
10.692
+0.447
4.36%
jan 1, 2007
11.045
+0.353
3.3%
jan 1, 2008
11.282
+0.237
2.15%
jan 1, 2009
11.718
+0.436
3.87%
jan 1, 2010
10.222
-1.496
-12.77%
jan 1, 2011
11.664
+1.442
14.11%
jan 1, 2012
12.44
+0.777
6.66%
jan 1, 2013
10.005
-2.435
-19.58%
jan 1, 2014
10.063
+0.058
0.58%
Ranking of countries by current statistics by years


Comments: