29
/
en
AIzaSyAYiBZKx7MnpbEhh9jyipgxe19OcubqV5w
April 1, 2024
53967
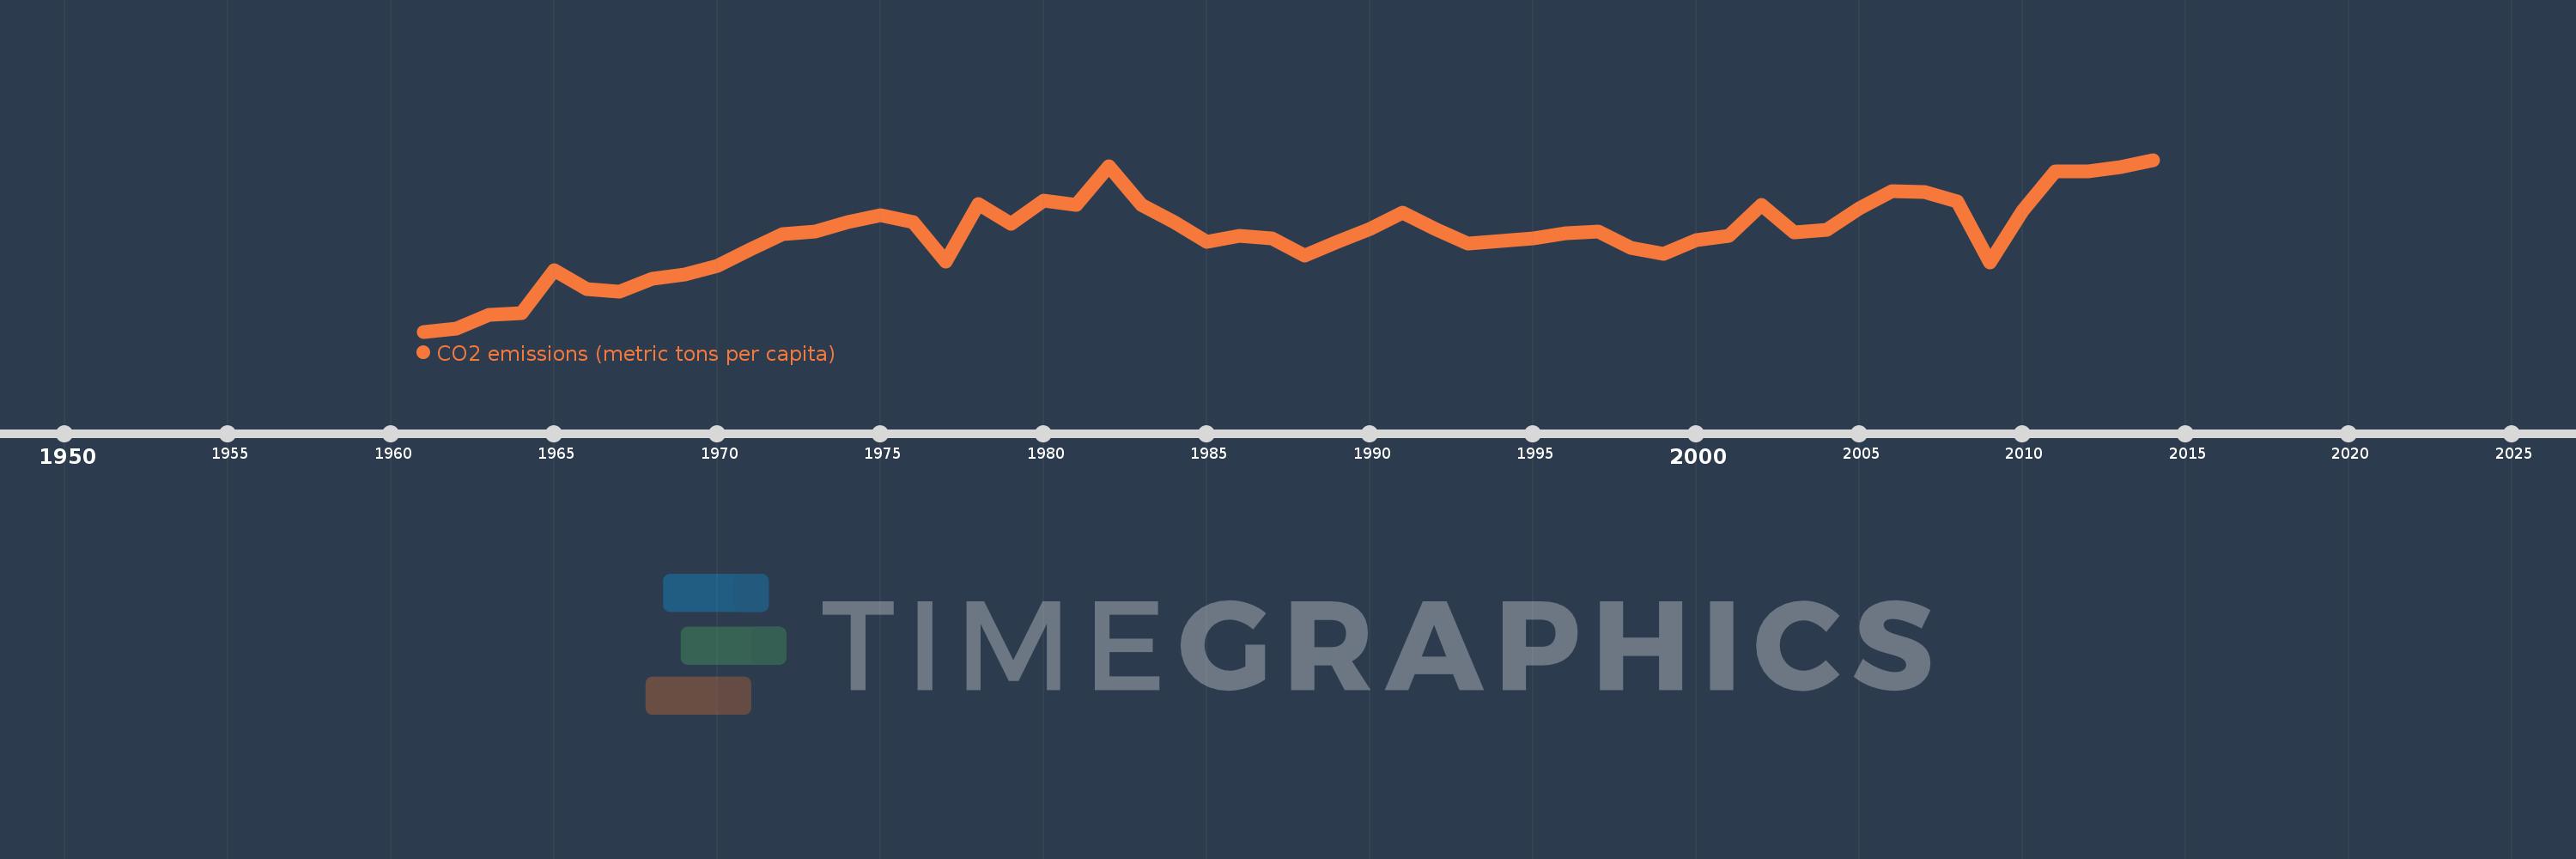
Pacific island small states
PSS
false
2
1
CO2 emissions (metric tons per capita)
2014,2013,2012,2011,2010,2009,2008,2007,2006,2005,2004,2003,2002,2001,2000,1999,1998,1997,1996,1995,1994,1993,1992,1991,1990,1989,1988,1987,1986,1985,1984,1983,1982,1981,1980,1979,1978,1977,1976,1975,1974,1973,1972,1971,1970,1969,1968,1967,1966,1965,1964,1963,1962,1961
This statistics in other country:
AfghanistanAlbaniaAlgeriaAndorraAngolaAntigua and BarbudaArab WorldArgentinaArmeniaArubaAustraliaAustriaAzerbaijanBahamas, TheBahrainBangladeshBarbadosBelarusBelgiumBelizeBeninBermudaBhutanBoliviaBosnia and HerzegovinaBotswanaBrazilBritish Virgin IslandsBrunei DarussalamBulgariaBurkina FasoBurundiCabo VerdeCambodiaCameroonCanadaCaribbean small statesCayman IslandsCentral African RepublicCentral Europe and the BalticsChadChileChinaColombiaComorosCongo, Dem. Rep.Congo, Rep.Costa RicaCote d'IvoireCroatiaCubaCuracaoCyprusCzech RepublicDenmarkDjiboutiDominicaDominican RepublicEarly-demographic dividendEast Asia & PacificEast Asia & Pacific (excluding high income)East Asia & Pacific (IDA & IBRD countries)EcuadorEgypt, Arab Rep.El SalvadorEquatorial GuineaEritreaEstoniaEthiopiaEuro areaEurope & Central AsiaEurope & Central Asia (excluding high income)Europe & Central Asia (IDA & IBRD countries)European UnionFaroe IslandsFijiFinlandFragile and conflict affected situationsFranceFrench PolynesiaGabonGambia, TheGeorgiaGermanyGhanaGibraltarGreeceGreenlandGrenadaGuatemalaGuineaGuinea-BissauGuyanaHaitiHeavily indebted poor countries (HIPC)High incomeHondurasHong Kong SAR, ChinaHungaryIBRD onlyIcelandIDA & IBRD totalIDA blendIDA onlyIDA totalIndiaIndonesiaIran, Islamic Rep.IraqIrelandIsraelItalyJamaicaJapanJordanKazakhstanKenyaKiribatiKorea, Dem. People’s Rep.Korea, Rep.KuwaitKyrgyz RepublicLao PDRLate-demographic dividendLatin America & Caribbean Latin America & Caribbean (excluding high income)Latin America & the Caribbean (IDA & IBRD countries)LatviaLeast developed countries: UN classificationLebanonLesothoLiberiaLibyaLiechtensteinLithuaniaLow & middle incomeLow incomeLower middle incomeLuxembourgMacao SAR, ChinaMacedonia, FYRMadagascarMalawiMalaysiaMaldivesMaliMaltaMarshall IslandsMauritaniaMauritiusMexicoMicronesia, Fed. Sts.Middle East & North AfricaMiddle East & North Africa (excluding high income)Middle East & North Africa (IDA & IBRD countries)Middle incomeMoldovaMongoliaMontenegroMoroccoMozambiqueMyanmarNamibiaNauruNepalNetherlandsNew CaledoniaNew ZealandNicaraguaNigerNigeriaNorth AmericaNorwayOECD membersOmanOther small statesPacific island small statesPakistanPalauPanamaPapua New GuineaParaguayPeruPhilippinesPolandPortugalPost-demographic dividendPre-demographic dividendQatarRomaniaRussian FederationRwandaSamoaSao Tome and PrincipeSaudi ArabiaSenegalSerbiaSeychellesSierra LeoneSingaporeSint Maarten (Dutch part)Slovak RepublicSloveniaSmall statesSolomon IslandsSomaliaSouth AfricaSouth AsiaSouth Asia (IDA & IBRD)South SudanSpainSri LankaSt. Kitts and NevisSt. LuciaSt. Vincent and the GrenadinesSub-Saharan Africa Sub-Saharan Africa (excluding high income)Sub-Saharan Africa (IDA & IBRD countries)SudanSurinameSwazilandSwedenSwitzerlandSyrian Arab RepublicTajikistanTanzaniaThailandTimor-LesteTogoTongaTrinidad and TobagoTunisiaTurkeyTurkmenistanTurks and Caicos IslandsUgandaUkraineUnited Arab EmiratesUnited KingdomUnited StatesUpper middle incomeUruguayUzbekistanVanuatuVenezuela, RBVietnamWest Bank and GazaWorldYemen, Rep.ZambiaZimbabwe Timeline:
This timeline shows a graph from 1961 to 2014 of Pacific island small states. No data until 1960. Number of actual observations by date: 54.
Source name:
World Development Indicators
Source organization:
Carbon Dioxide Information Analysis Center, Environmental Sciences Division, Oak Ridge National Laboratory, Tennessee, United States.
Categories, topics:
Climate Change, Environment
Last updated:
apr 23, 2017
Indicators value changes by year
At the date of observation
Value
Absolute change
Change from previous value
jan 1, 1961
0.373
+0.373
0.0%
jan 1, 1962
0.388
+0.015
4.05%
jan 1, 1963
0.467
+0.079
20.29%
jan 1, 1964
0.474
+0.007
1.46%
jan 1, 1965
0.718
+0.244
51.6%
jan 1, 1966
0.61
-0.108
-15.01%
jan 1, 1967
0.597
-0.013
-2.13%
jan 1, 1968
0.667
+0.07
11.76%
jan 1, 1969
0.691
+0.024
3.54%
jan 1, 1970
0.739
+0.048
6.9%
jan 1, 1971
0.833
+0.094
12.77%
jan 1, 1972
0.92
+0.087
10.44%
jan 1, 1973
0.934
+0.014
1.49%
jan 1, 1974
0.986
+0.052
5.6%
jan 1, 1975
1.026
+0.04
4.1%
jan 1, 1976
0.987
-0.04
-3.86%
jan 1, 1977
0.765
-0.222
-22.48%
jan 1, 1978
1.085
+0.32
41.9%
jan 1, 1979
0.978
-0.107
-9.87%
jan 1, 1980
1.107
+0.129
13.21%
jan 1, 1981
1.084
-0.024
-2.16%
jan 1, 1982
1.298
+0.215
19.83%
jan 1, 1983
1.083
-0.216
-16.61%
jan 1, 1984
0.987
-0.096
-8.83%
jan 1, 1985
0.874
-0.113
-11.48%
jan 1, 1986
0.908
+0.034
3.93%
jan 1, 1987
0.894
-0.014
-1.55%
jan 1, 1988
0.799
-0.095
-10.62%
jan 1, 1989
0.874
+0.075
9.43%
jan 1, 1990
0.947
+0.073
8.35%
jan 1, 1991
1.038
+0.091
9.58%
jan 1, 1992
0.948
-0.091
-8.73%
jan 1, 1993
0.865
-0.083
-8.71%
jan 1, 1994
0.88
+0.015
1.78%
jan 1, 1995
0.896
+0.015
1.71%
jan 1, 1996
0.924
+0.028
3.13%
jan 1, 1997
0.933
+0.009
1.03%
jan 1, 1998
0.841
-0.093
-9.92%
jan 1, 1999
0.809
-0.032
-3.78%
jan 1, 2000
0.883
+0.074
9.16%
jan 1, 2001
0.911
+0.028
3.13%
jan 1, 2002
1.081
+0.171
18.75%
jan 1, 2003
0.928
-0.153
-14.14%
jan 1, 2004
0.944
+0.016
1.73%
jan 1, 2005
1.061
+0.116
12.31%
jan 1, 2006
1.161
+0.1
9.46%
jan 1, 2007
1.156
-0.005
-0.46%
jan 1, 2008
1.102
-0.053
-4.6%
jan 1, 2009
0.758
-0.344
-31.21%
jan 1, 2010
1.048
+0.289
38.17%
jan 1, 2011
1.268
+0.22
21.02%
jan 1, 2012
1.267
-0.001
-0.1%
jan 1, 2013
1.293
+0.027
2.1%
jan 1, 2014
1.334
+0.041
3.14%
Ranking of countries by current statistics by years


Comments: