29
/
en
AIzaSyAYiBZKx7MnpbEhh9jyipgxe19OcubqV5w
April 1, 2024
104656
Chile
CHL
true
2
1
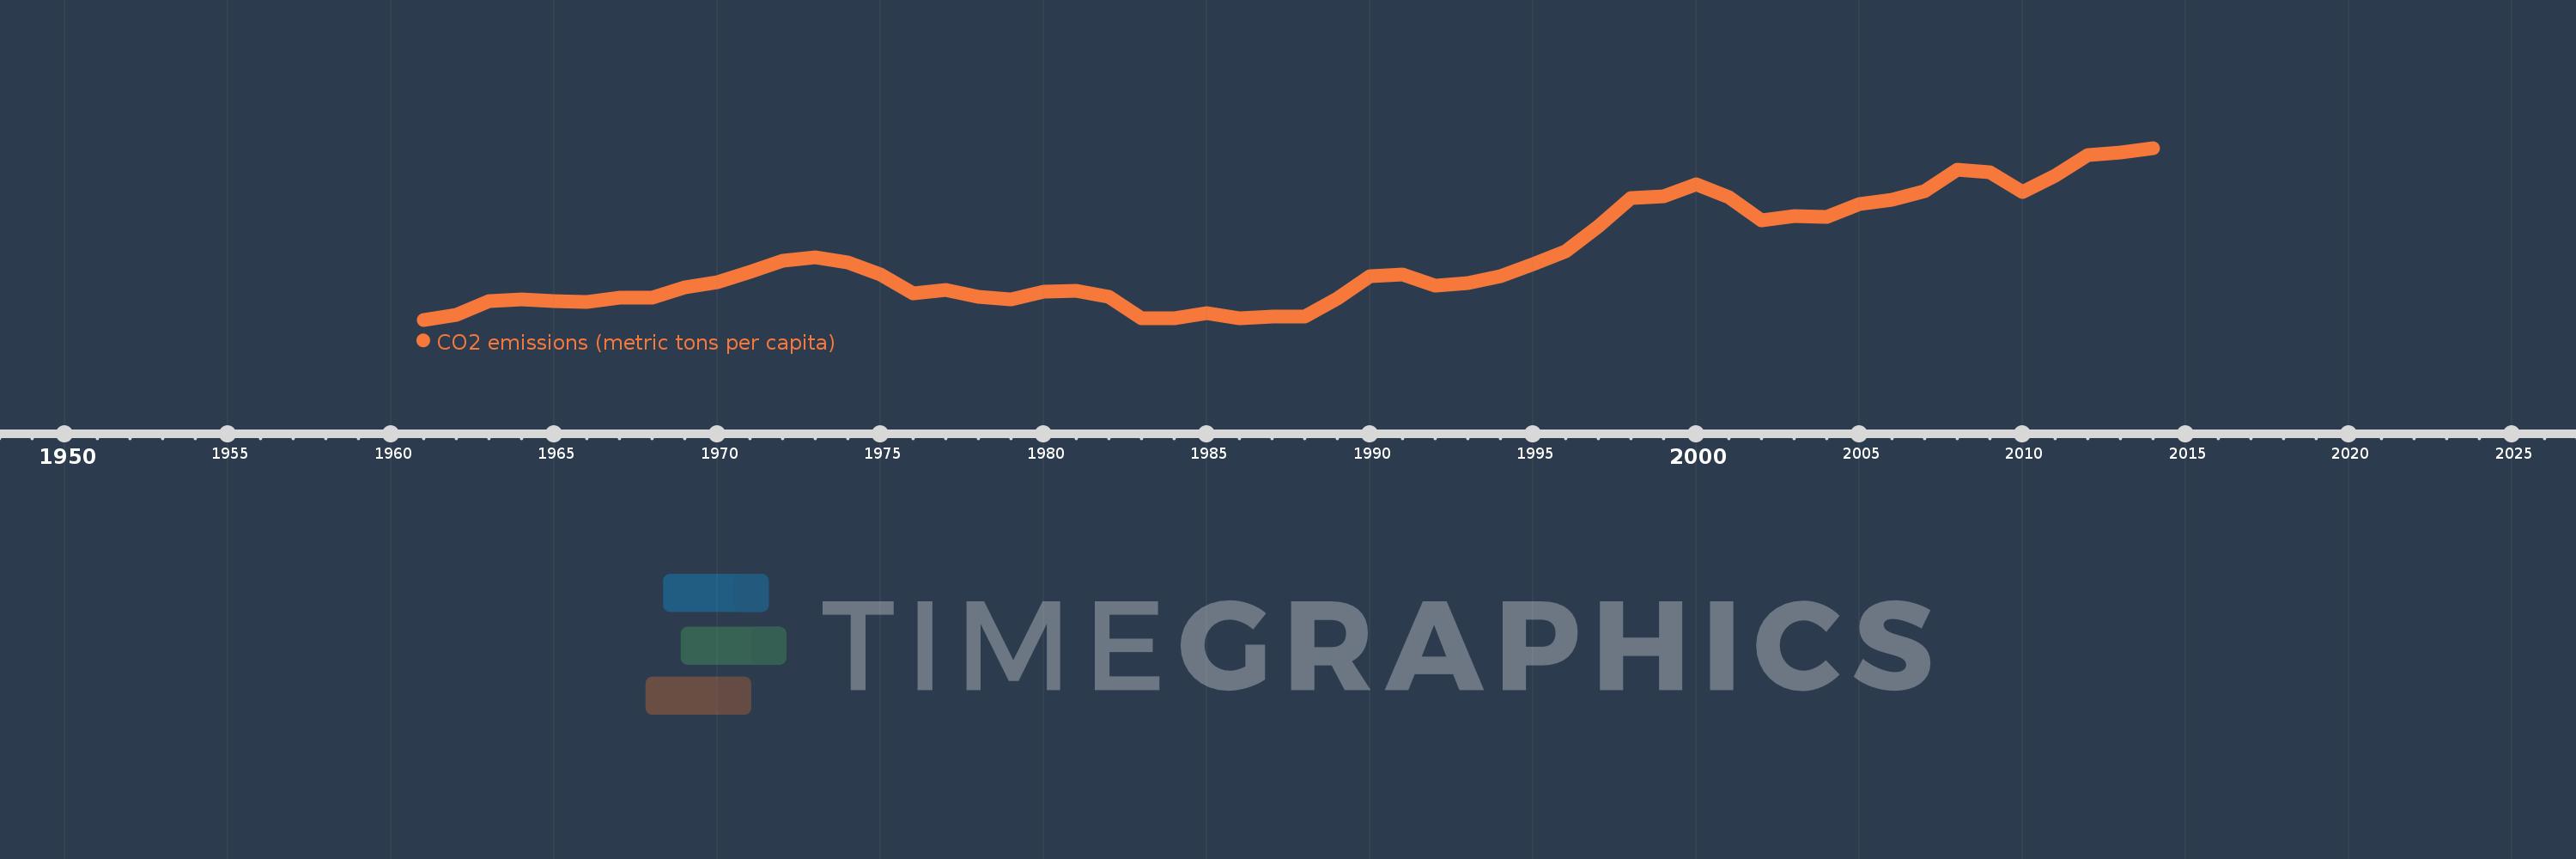
CO2 emissions (metric tons per capita)
2014,2013,2012,2011,2010,2009,2008,2007,2006,2005,2004,2003,2002,2001,2000,1999,1998,1997,1996,1995,1994,1993,1992,1991,1990,1989,1988,1987,1986,1985,1984,1983,1982,1981,1980,1979,1978,1977,1976,1975,1974,1973,1972,1971,1970,1969,1968,1967,1966,1965,1964,1963,1962,1961
This statistics in other country:
AfghanistanAlbaniaAlgeriaAndorraAngolaAntigua and BarbudaArab WorldArgentinaArmeniaArubaAustraliaAustriaAzerbaijanBahamas, TheBahrainBangladeshBarbadosBelarusBelgiumBelizeBeninBermudaBhutanBoliviaBosnia and HerzegovinaBotswanaBrazilBritish Virgin IslandsBrunei DarussalamBulgariaBurkina FasoBurundiCabo VerdeCambodiaCameroonCanadaCaribbean small statesCayman IslandsCentral African RepublicCentral Europe and the BalticsChadChileChinaColombiaComorosCongo, Dem. Rep.Congo, Rep.Costa RicaCote d'IvoireCroatiaCubaCuracaoCyprusCzech RepublicDenmarkDjiboutiDominicaDominican RepublicEarly-demographic dividendEast Asia & PacificEast Asia & Pacific (excluding high income)East Asia & Pacific (IDA & IBRD countries)EcuadorEgypt, Arab Rep.El SalvadorEquatorial GuineaEritreaEstoniaEthiopiaEuro areaEurope & Central AsiaEurope & Central Asia (excluding high income)Europe & Central Asia (IDA & IBRD countries)European UnionFaroe IslandsFijiFinlandFragile and conflict affected situationsFranceFrench PolynesiaGabonGambia, TheGeorgiaGermanyGhanaGibraltarGreeceGreenlandGrenadaGuatemalaGuineaGuinea-BissauGuyanaHaitiHeavily indebted poor countries (HIPC)High incomeHondurasHong Kong SAR, ChinaHungaryIBRD onlyIcelandIDA & IBRD totalIDA blendIDA onlyIDA totalIndiaIndonesiaIran, Islamic Rep.IraqIrelandIsraelItalyJamaicaJapanJordanKazakhstanKenyaKiribatiKorea, Dem. People’s Rep.Korea, Rep.KuwaitKyrgyz RepublicLao PDRLate-demographic dividendLatin America & Caribbean Latin America & Caribbean (excluding high income)Latin America & the Caribbean (IDA & IBRD countries)LatviaLeast developed countries: UN classificationLebanonLesothoLiberiaLibyaLiechtensteinLithuaniaLow & middle incomeLow incomeLower middle incomeLuxembourgMacao SAR, ChinaMacedonia, FYRMadagascarMalawiMalaysiaMaldivesMaliMaltaMarshall IslandsMauritaniaMauritiusMexicoMicronesia, Fed. Sts.Middle East & North AfricaMiddle East & North Africa (excluding high income)Middle East & North Africa (IDA & IBRD countries)Middle incomeMoldovaMongoliaMontenegroMoroccoMozambiqueMyanmarNamibiaNauruNepalNetherlandsNew CaledoniaNew ZealandNicaraguaNigerNigeriaNorth AmericaNorwayOECD membersOmanOther small statesPacific island small statesPakistanPalauPanamaPapua New GuineaParaguayPeruPhilippinesPolandPortugalPost-demographic dividendPre-demographic dividendQatarRomaniaRussian FederationRwandaSamoaSao Tome and PrincipeSaudi ArabiaSenegalSerbiaSeychellesSierra LeoneSingaporeSint Maarten (Dutch part)Slovak RepublicSloveniaSmall statesSolomon IslandsSomaliaSouth AfricaSouth AsiaSouth Asia (IDA & IBRD)South SudanSpainSri LankaSt. Kitts and NevisSt. LuciaSt. Vincent and the GrenadinesSub-Saharan Africa Sub-Saharan Africa (excluding high income)Sub-Saharan Africa (IDA & IBRD countries)SudanSurinameSwazilandSwedenSwitzerlandSyrian Arab RepublicTajikistanTanzaniaThailandTimor-LesteTogoTongaTrinidad and TobagoTunisiaTurkeyTurkmenistanTurks and Caicos IslandsUgandaUkraineUnited Arab EmiratesUnited KingdomUnited StatesUpper middle incomeUruguayUzbekistanVanuatuVenezuela, RBVietnamWest Bank and GazaWorldYemen, Rep.ZambiaZimbabwe Timeline:
This timeline shows a graph from 1961 to 2014 of Chile. No data until 1960. Number of actual observations by date: 54.
Source name:
World Development Indicators
Source organization:
Carbon Dioxide Information Analysis Center, Environmental Sciences Division, Oak Ridge National Laboratory, Tennessee, United States.
Categories, topics:
Climate Change, Environment
Last updated:
apr 23, 2017
Indicators value changes by year
At the date of observation
Value
Absolute change
Change from previous value
jan 1, 1961
1.753
+1.753
0.0%
jan 1, 1962
1.838
+0.085
4.86%
jan 1, 1963
2.077
+0.238
12.96%
jan 1, 1964
2.107
+0.03
1.46%
jan 1, 1965
2.08
-0.027
-1.26%
jan 1, 1966
2.063
-0.017
-0.84%
jan 1, 1967
2.135
+0.072
3.49%
jan 1, 1968
2.141
+0.006
0.29%
jan 1, 1969
2.31
+0.169
7.9%
jan 1, 1970
2.405
+0.095
4.12%
jan 1, 1971
2.579
+0.174
7.23%
jan 1, 1972
2.781
+0.202
7.83%
jan 1, 1973
2.843
+0.061
2.21%
jan 1, 1974
2.741
-0.102
-3.57%
jan 1, 1975
2.531
-0.21
-7.67%
jan 1, 1976
2.209
-0.322
-12.74%
jan 1, 1977
2.277
+0.069
3.11%
jan 1, 1978
2.15
-0.127
-5.57%
jan 1, 1979
2.104
-0.047
-2.17%
jan 1, 1980
2.246
+0.142
6.75%
jan 1, 1981
2.249
+0.003
0.14%
jan 1, 1982
2.154
-0.095
-4.23%
jan 1, 1983
1.782
-0.372
-17.26%
jan 1, 1984
1.775
-0.007
-0.4%
jan 1, 1985
1.862
+0.087
4.93%
jan 1, 1986
1.776
-0.086
-4.64%
jan 1, 1987
1.808
+0.032
1.82%
jan 1, 1988
1.813
+0.005
0.26%
jan 1, 1989
2.117
+0.305
16.81%
jan 1, 1990
2.505
+0.388
18.31%
jan 1, 1991
2.535
+0.03
1.2%
jan 1, 1992
2.346
-0.19
-7.48%
jan 1, 1993
2.394
+0.048
2.05%
jan 1, 1994
2.513
+0.119
4.99%
jan 1, 1995
2.724
+0.211
8.39%
jan 1, 1996
2.941
+0.217
7.97%
jan 1, 1997
3.369
+0.428
14.55%
jan 1, 1998
3.864
+0.495
14.7%
jan 1, 1999
3.898
+0.033
0.87%
jan 1, 2000
4.106
+0.208
5.33%
jan 1, 2001
3.877
-0.229
-5.57%
jan 1, 2002
3.473
-0.404
-10.42%
jan 1, 2003
3.549
+0.076
2.18%
jan 1, 2004
3.535
-0.014
-0.39%
jan 1, 2005
3.756
+0.221
6.26%
jan 1, 2006
3.84
+0.084
2.24%
jan 1, 2007
3.981
+0.141
3.67%
jan 1, 2008
4.352
+0.37
9.3%
jan 1, 2009
4.316
-0.035
-0.81%
jan 1, 2010
3.969
-0.347
-8.04%
jan 1, 2011
4.246
+0.277
6.97%
jan 1, 2012
4.607
+0.361
8.49%
jan 1, 2013
4.657
+0.05
1.08%
jan 1, 2014
4.732
+0.075
1.62%
Ranking of countries by current statistics by years


Comments: