29
/
en
AIzaSyAYiBZKx7MnpbEhh9jyipgxe19OcubqV5w
April 1, 2024
261983
Thailand
THA
true
2
1
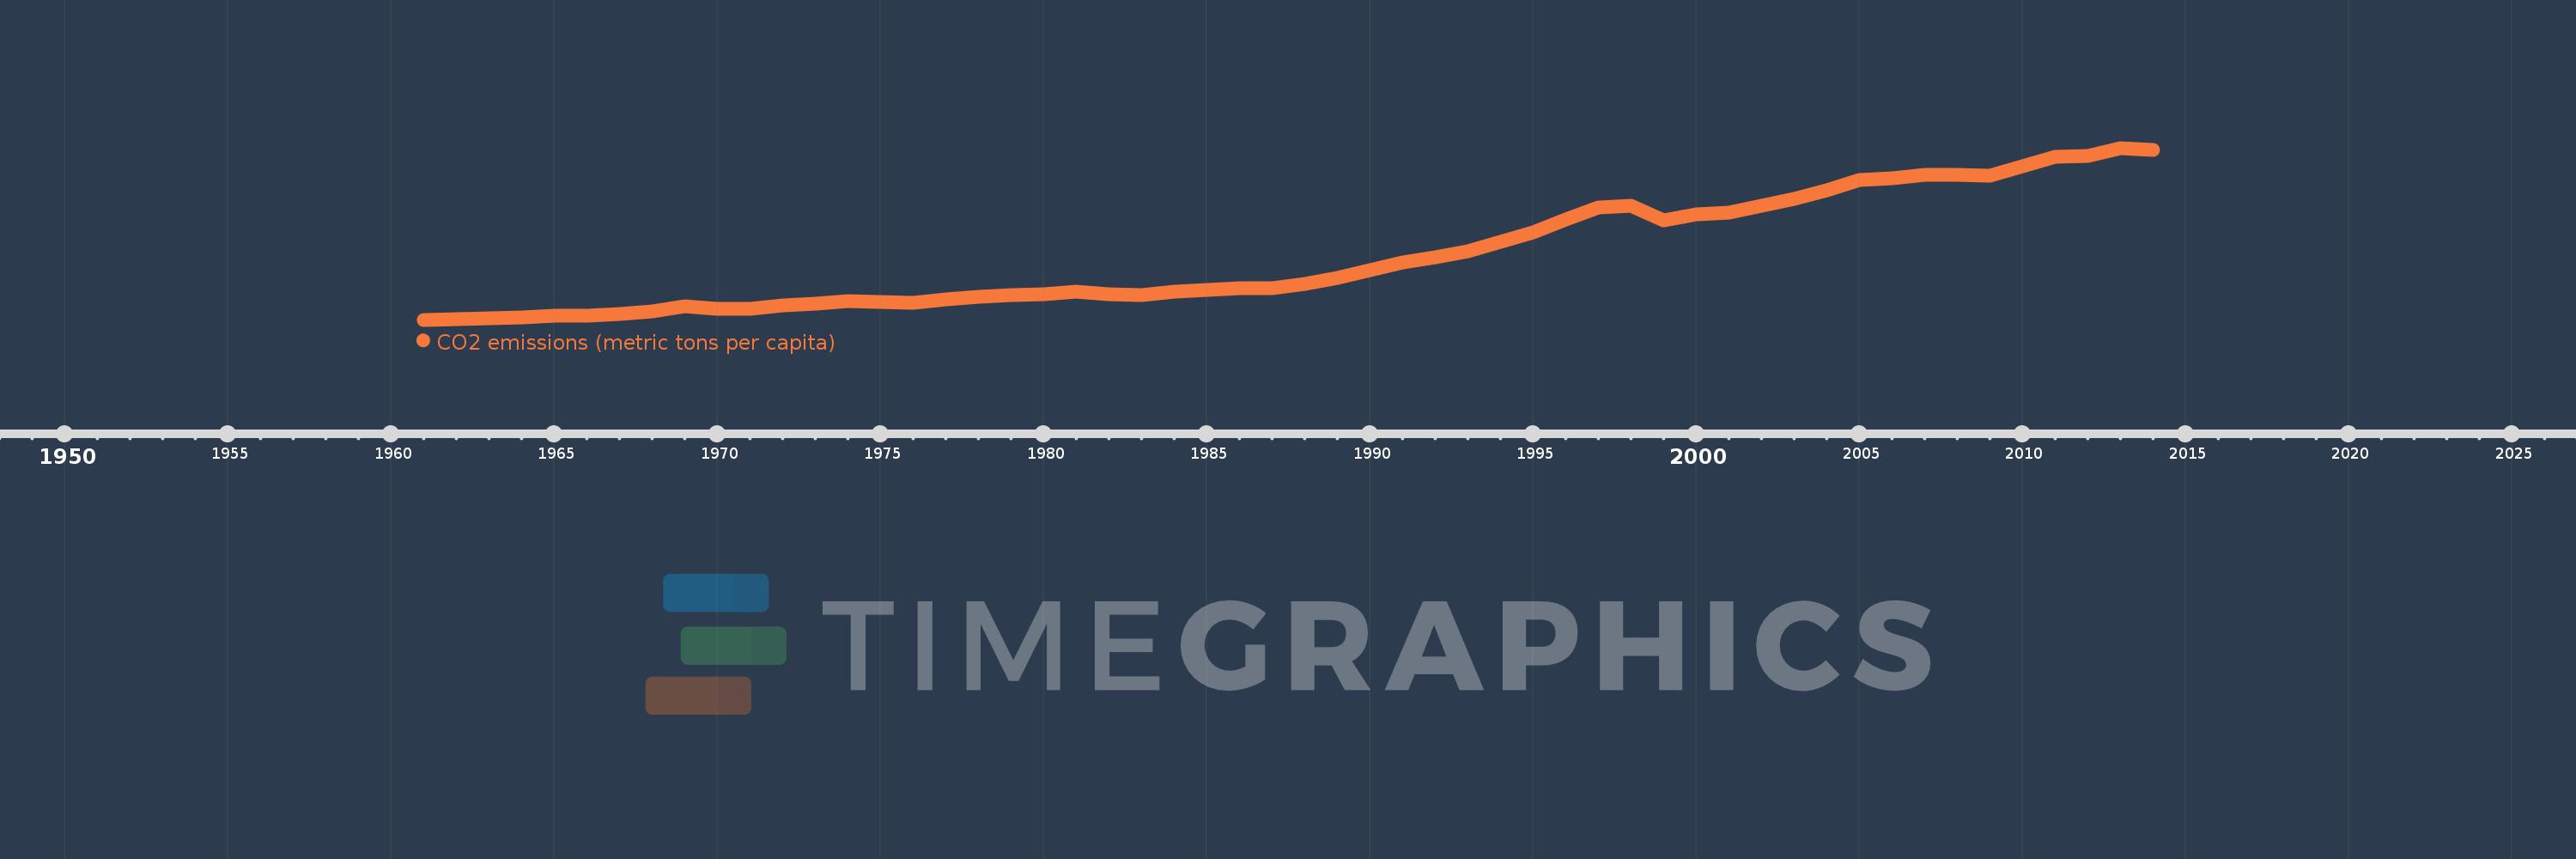
CO2 emissions (metric tons per capita)
2014,2013,2012,2011,2010,2009,2008,2007,2006,2005,2004,2003,2002,2001,2000,1999,1998,1997,1996,1995,1994,1993,1992,1991,1990,1989,1988,1987,1986,1985,1984,1983,1982,1981,1980,1979,1978,1977,1976,1975,1974,1973,1972,1971,1970,1969,1968,1967,1966,1965,1964,1963,1962,1961
This statistics in other country:
AfghanistanAlbaniaAlgeriaAndorraAngolaAntigua and BarbudaArab WorldArgentinaArmeniaArubaAustraliaAustriaAzerbaijanBahamas, TheBahrainBangladeshBarbadosBelarusBelgiumBelizeBeninBermudaBhutanBoliviaBosnia and HerzegovinaBotswanaBrazilBritish Virgin IslandsBrunei DarussalamBulgariaBurkina FasoBurundiCabo VerdeCambodiaCameroonCanadaCaribbean small statesCayman IslandsCentral African RepublicCentral Europe and the BalticsChadChileChinaColombiaComorosCongo, Dem. Rep.Congo, Rep.Costa RicaCote d'IvoireCroatiaCubaCuracaoCyprusCzech RepublicDenmarkDjiboutiDominicaDominican RepublicEarly-demographic dividendEast Asia & PacificEast Asia & Pacific (excluding high income)East Asia & Pacific (IDA & IBRD countries)EcuadorEgypt, Arab Rep.El SalvadorEquatorial GuineaEritreaEstoniaEthiopiaEuro areaEurope & Central AsiaEurope & Central Asia (excluding high income)Europe & Central Asia (IDA & IBRD countries)European UnionFaroe IslandsFijiFinlandFragile and conflict affected situationsFranceFrench PolynesiaGabonGambia, TheGeorgiaGermanyGhanaGibraltarGreeceGreenlandGrenadaGuatemalaGuineaGuinea-BissauGuyanaHaitiHeavily indebted poor countries (HIPC)High incomeHondurasHong Kong SAR, ChinaHungaryIBRD onlyIcelandIDA & IBRD totalIDA blendIDA onlyIDA totalIndiaIndonesiaIran, Islamic Rep.IraqIrelandIsraelItalyJamaicaJapanJordanKazakhstanKenyaKiribatiKorea, Dem. People’s Rep.Korea, Rep.KuwaitKyrgyz RepublicLao PDRLate-demographic dividendLatin America & Caribbean Latin America & Caribbean (excluding high income)Latin America & the Caribbean (IDA & IBRD countries)LatviaLeast developed countries: UN classificationLebanonLesothoLiberiaLibyaLiechtensteinLithuaniaLow & middle incomeLow incomeLower middle incomeLuxembourgMacao SAR, ChinaMacedonia, FYRMadagascarMalawiMalaysiaMaldivesMaliMaltaMarshall IslandsMauritaniaMauritiusMexicoMicronesia, Fed. Sts.Middle East & North AfricaMiddle East & North Africa (excluding high income)Middle East & North Africa (IDA & IBRD countries)Middle incomeMoldovaMongoliaMontenegroMoroccoMozambiqueMyanmarNamibiaNauruNepalNetherlandsNew CaledoniaNew ZealandNicaraguaNigerNigeriaNorth AmericaNorwayOECD membersOmanOther small statesPacific island small statesPakistanPalauPanamaPapua New GuineaParaguayPeruPhilippinesPolandPortugalPost-demographic dividendPre-demographic dividendQatarRomaniaRussian FederationRwandaSamoaSao Tome and PrincipeSaudi ArabiaSenegalSerbiaSeychellesSierra LeoneSingaporeSint Maarten (Dutch part)Slovak RepublicSloveniaSmall statesSolomon IslandsSomaliaSouth AfricaSouth AsiaSouth Asia (IDA & IBRD)South SudanSpainSri LankaSt. Kitts and NevisSt. LuciaSt. Vincent and the GrenadinesSub-Saharan Africa Sub-Saharan Africa (excluding high income)Sub-Saharan Africa (IDA & IBRD countries)SudanSurinameSwazilandSwedenSwitzerlandSyrian Arab RepublicTajikistanTanzaniaThailandTimor-LesteTogoTongaTrinidad and TobagoTunisiaTurkeyTurkmenistanTurks and Caicos IslandsUgandaUkraineUnited Arab EmiratesUnited KingdomUnited StatesUpper middle incomeUruguayUzbekistanVanuatuVenezuela, RBVietnamWest Bank and GazaWorldYemen, Rep.ZambiaZimbabwe Timeline:
This timeline shows a graph from 1961 to 2014 of Thailand. No data until 1960. Number of actual observations by date: 54.
Source name:
World Development Indicators
Source organization:
Carbon Dioxide Information Analysis Center, Environmental Sciences Division, Oak Ridge National Laboratory, Tennessee, United States.
Categories, topics:
Climate Change, Environment
Last updated:
apr 23, 2017
Indicators value changes by year
At the date of observation
Value
Absolute change
Change from previous value
jan 1, 1961
0.136
+0.136
0.0%
jan 1, 1962
0.147
+0.011
8.38%
jan 1, 1963
0.173
+0.026
17.82%
jan 1, 1964
0.186
+0.013
7.36%
jan 1, 1965
0.242
+0.056
30.32%
jan 1, 1966
0.234
-0.008
-3.34%
jan 1, 1967
0.289
+0.055
23.47%
jan 1, 1968
0.36
+0.071
24.6%
jan 1, 1969
0.491
+0.131
36.45%
jan 1, 1970
0.406
-0.085
-17.3%
jan 1, 1971
0.417
+0.01
2.56%
jan 1, 1972
0.507
+0.09
21.62%
jan 1, 1973
0.559
+0.052
10.26%
jan 1, 1974
0.609
+0.05
8.91%
jan 1, 1975
0.588
-0.021
-3.48%
jan 1, 1976
0.577
-0.011
-1.89%
jan 1, 1977
0.663
+0.087
15.05%
jan 1, 1978
0.724
+0.061
9.16%
jan 1, 1979
0.772
+0.048
6.62%
jan 1, 1980
0.792
+0.02
2.53%
jan 1, 1981
0.847
+0.055
7.01%
jan 1, 1982
0.787
-0.06
-7.06%
jan 1, 1983
0.769
-0.018
-2.24%
jan 1, 1984
0.846
+0.076
9.94%
jan 1, 1985
0.9
+0.054
6.34%
jan 1, 1986
0.935
+0.036
3.97%
jan 1, 1987
0.938
+0.002
0.26%
jan 1, 1988
1.055
+0.117
12.5%
jan 1, 1989
1.22
+0.165
15.62%
jan 1, 1990
1.414
+0.194
15.89%
jan 1, 1991
1.605
+0.191
13.54%
jan 1, 1992
1.744
+0.139
8.65%
jan 1, 1993
1.901
+0.157
9.0%
jan 1, 1994
2.146
+0.245
12.89%
jan 1, 1995
2.37
+0.224
10.45%
jan 1, 1996
2.719
+0.349
14.74%
jan 1, 1997
3.01
+0.291
10.71%
jan 1, 1998
3.071
+0.06
2.01%
jan 1, 1999
2.683
-0.388
-12.62%
jan 1, 2000
2.842
+0.159
5.92%
jan 1, 2001
2.891
+0.049
1.74%
jan 1, 2002
3.069
+0.177
6.13%
jan 1, 2003
3.248
+0.179
5.85%
jan 1, 2004
3.465
+0.217
6.67%
jan 1, 2005
3.718
+0.253
7.32%
jan 1, 2006
3.757
+0.039
1.05%
jan 1, 2007
3.854
+0.097
2.57%
jan 1, 2008
3.848
-0.006
-0.16%
jan 1, 2009
3.843
-0.005
-0.13%
jan 1, 2010
4.064
+0.221
5.75%
jan 1, 2011
4.327
+0.264
6.49%
jan 1, 2012
4.34
+0.013
0.29%
jan 1, 2013
4.544
+0.205
4.72%
jan 1, 2014
4.494
-0.051
-1.11%
Ranking of countries by current statistics by years


Comments: