29
/
en
AIzaSyAYiBZKx7MnpbEhh9jyipgxe19OcubqV5w
April 1, 2024
46922
Lower middle income
LMC
false
2
1
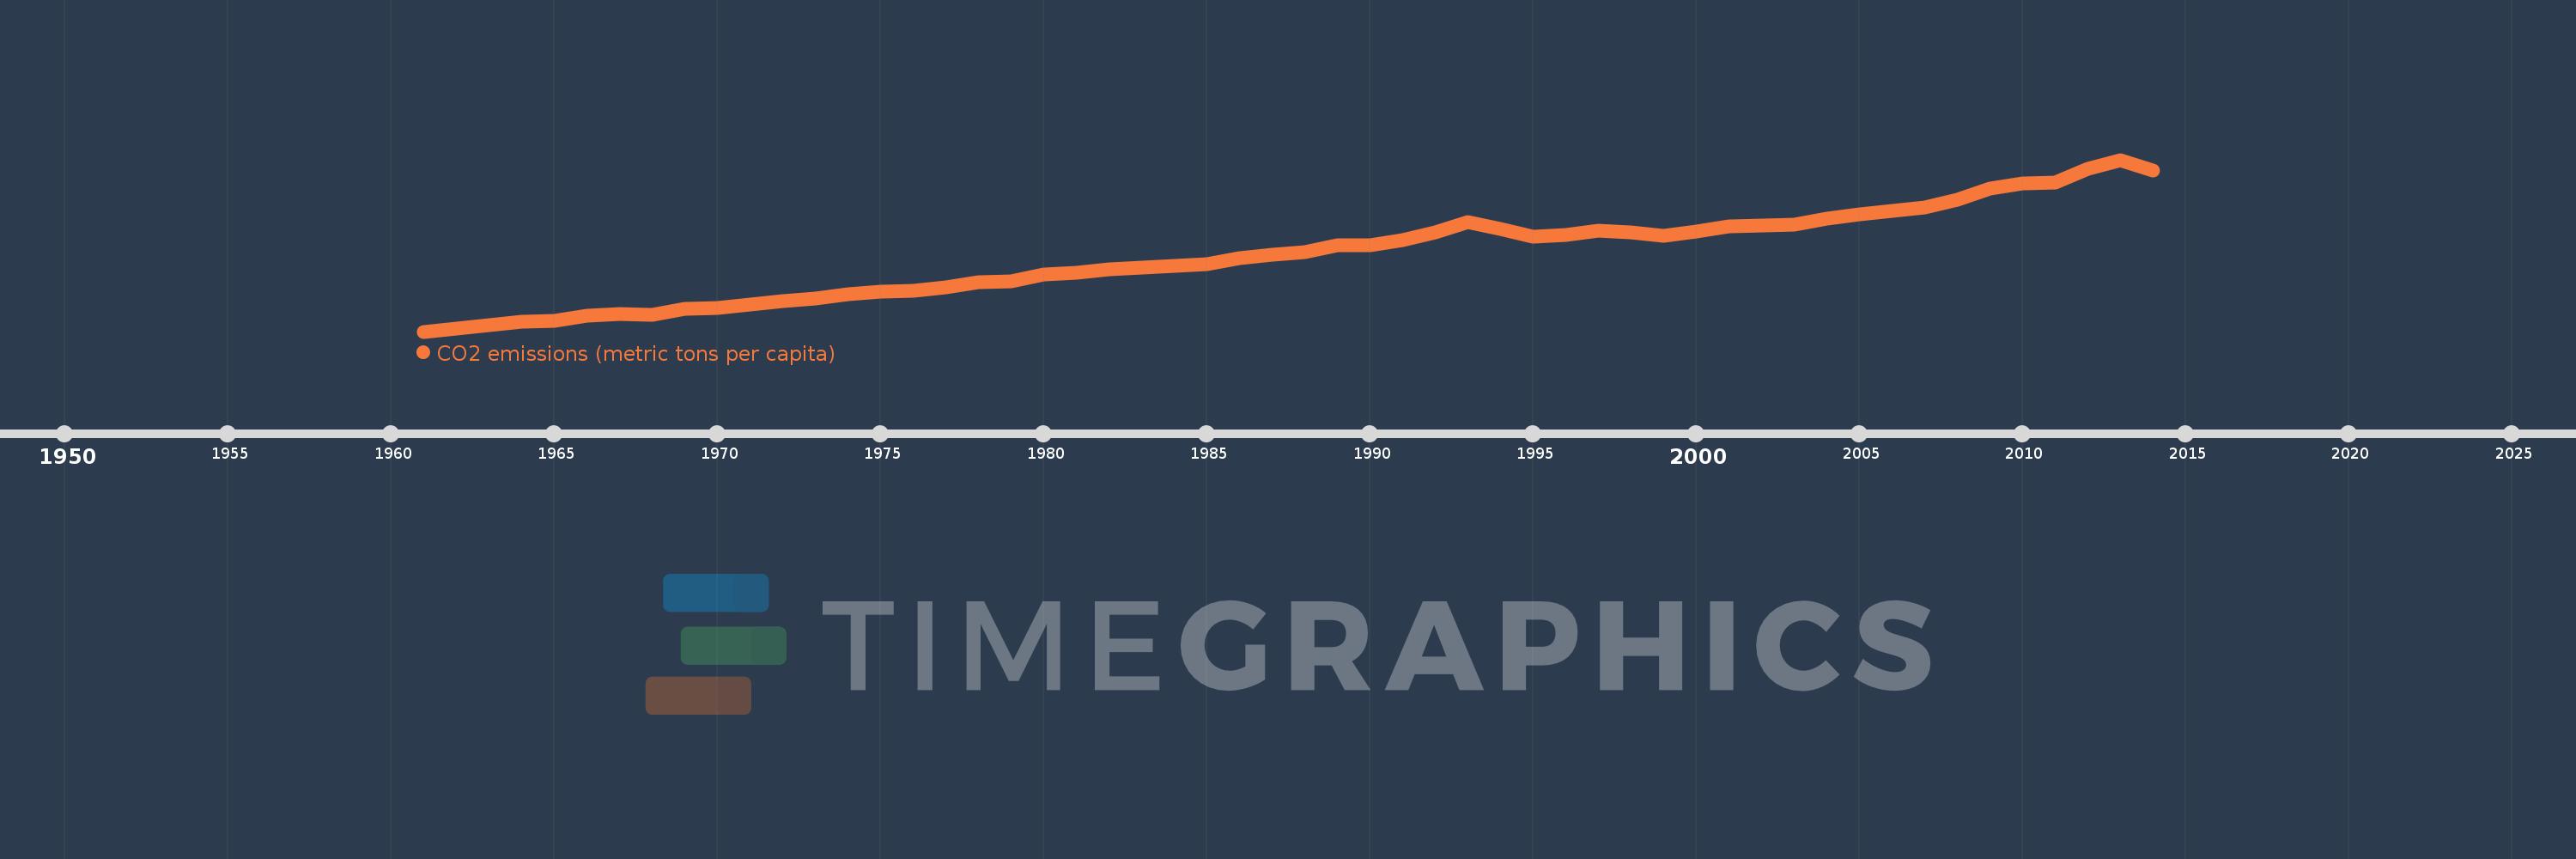
CO2 emissions (metric tons per capita)
2014,2013,2012,2011,2010,2009,2008,2007,2006,2005,2004,2003,2002,2001,2000,1999,1998,1997,1996,1995,1994,1993,1992,1991,1990,1989,1988,1987,1986,1985,1984,1983,1982,1981,1980,1979,1978,1977,1976,1975,1974,1973,1972,1971,1970,1969,1968,1967,1966,1965,1964,1963,1962,1961
This statistics in other country:
AfghanistanAlbaniaAlgeriaAndorraAngolaAntigua and BarbudaArab WorldArgentinaArmeniaArubaAustraliaAustriaAzerbaijanBahamas, TheBahrainBangladeshBarbadosBelarusBelgiumBelizeBeninBermudaBhutanBoliviaBosnia and HerzegovinaBotswanaBrazilBritish Virgin IslandsBrunei DarussalamBulgariaBurkina FasoBurundiCabo VerdeCambodiaCameroonCanadaCaribbean small statesCayman IslandsCentral African RepublicCentral Europe and the BalticsChadChileChinaColombiaComorosCongo, Dem. Rep.Congo, Rep.Costa RicaCote d'IvoireCroatiaCubaCuracaoCyprusCzech RepublicDenmarkDjiboutiDominicaDominican RepublicEarly-demographic dividendEast Asia & PacificEast Asia & Pacific (excluding high income)East Asia & Pacific (IDA & IBRD countries)EcuadorEgypt, Arab Rep.El SalvadorEquatorial GuineaEritreaEstoniaEthiopiaEuro areaEurope & Central AsiaEurope & Central Asia (excluding high income)Europe & Central Asia (IDA & IBRD countries)European UnionFaroe IslandsFijiFinlandFragile and conflict affected situationsFranceFrench PolynesiaGabonGambia, TheGeorgiaGermanyGhanaGibraltarGreeceGreenlandGrenadaGuatemalaGuineaGuinea-BissauGuyanaHaitiHeavily indebted poor countries (HIPC)High incomeHondurasHong Kong SAR, ChinaHungaryIBRD onlyIcelandIDA & IBRD totalIDA blendIDA onlyIDA totalIndiaIndonesiaIran, Islamic Rep.IraqIrelandIsraelItalyJamaicaJapanJordanKazakhstanKenyaKiribatiKorea, Dem. People’s Rep.Korea, Rep.KuwaitKyrgyz RepublicLao PDRLate-demographic dividendLatin America & Caribbean Latin America & Caribbean (excluding high income)Latin America & the Caribbean (IDA & IBRD countries)LatviaLeast developed countries: UN classificationLebanonLesothoLiberiaLibyaLiechtensteinLithuaniaLow & middle incomeLow incomeLower middle incomeLuxembourgMacao SAR, ChinaMacedonia, FYRMadagascarMalawiMalaysiaMaldivesMaliMaltaMarshall IslandsMauritaniaMauritiusMexicoMicronesia, Fed. Sts.Middle East & North AfricaMiddle East & North Africa (excluding high income)Middle East & North Africa (IDA & IBRD countries)Middle incomeMoldovaMongoliaMontenegroMoroccoMozambiqueMyanmarNamibiaNauruNepalNetherlandsNew CaledoniaNew ZealandNicaraguaNigerNigeriaNorth AmericaNorwayOECD membersOmanOther small statesPacific island small statesPakistanPalauPanamaPapua New GuineaParaguayPeruPhilippinesPolandPortugalPost-demographic dividendPre-demographic dividendQatarRomaniaRussian FederationRwandaSamoaSao Tome and PrincipeSaudi ArabiaSenegalSerbiaSeychellesSierra LeoneSingaporeSint Maarten (Dutch part)Slovak RepublicSloveniaSmall statesSolomon IslandsSomaliaSouth AfricaSouth AsiaSouth Asia (IDA & IBRD)South SudanSpainSri LankaSt. Kitts and NevisSt. LuciaSt. Vincent and the GrenadinesSub-Saharan Africa Sub-Saharan Africa (excluding high income)Sub-Saharan Africa (IDA & IBRD countries)SudanSurinameSwazilandSwedenSwitzerlandSyrian Arab RepublicTajikistanTanzaniaThailandTimor-LesteTogoTongaTrinidad and TobagoTunisiaTurkeyTurkmenistanTurks and Caicos IslandsUgandaUkraineUnited Arab EmiratesUnited KingdomUnited StatesUpper middle incomeUruguayUzbekistanVanuatuVenezuela, RBVietnamWest Bank and GazaWorldYemen, Rep.ZambiaZimbabwe Timeline:
This timeline shows a graph from 1961 to 2014 of Lower middle income. No data until 1960. Number of actual observations by date: 54.
Source name:
World Development Indicators
Source organization:
Carbon Dioxide Information Analysis Center, Environmental Sciences Division, Oak Ridge National Laboratory, Tennessee, United States.
Categories, topics:
Climate Change, Environment
Last updated:
apr 23, 2017
Indicators value changes by year
At the date of observation
Value
Absolute change
Change from previous value
jan 1, 1961
0.374
+0.374
0.0%
jan 1, 1962
0.394
+0.02
5.32%
jan 1, 1963
0.415
+0.021
5.35%
jan 1, 1964
0.437
+0.022
5.21%
jan 1, 1965
0.444
+0.007
1.58%
jan 1, 1966
0.476
+0.032
7.29%
jan 1, 1967
0.489
+0.013
2.73%
jan 1, 1968
0.486
-0.003
-0.71%
jan 1, 1969
0.524
+0.038
7.83%
jan 1, 1970
0.531
+0.007
1.37%
jan 1, 1971
0.55
+0.019
3.64%
jan 1, 1972
0.574
+0.024
4.35%
jan 1, 1973
0.591
+0.016
2.87%
jan 1, 1974
0.618
+0.027
4.54%
jan 1, 1975
0.634
+0.016
2.59%
jan 1, 1976
0.644
+0.01
1.58%
jan 1, 1977
0.663
+0.019
2.95%
jan 1, 1978
0.698
+0.036
5.4%
jan 1, 1979
0.706
+0.008
1.17%
jan 1, 1980
0.751
+0.044
6.26%
jan 1, 1981
0.759
+0.008
1.1%
jan 1, 1982
0.784
+0.025
3.25%
jan 1, 1983
0.793
+0.009
1.21%
jan 1, 1984
0.807
+0.014
1.73%
jan 1, 1985
0.819
+0.013
1.55%
jan 1, 1986
0.855
+0.036
4.36%
jan 1, 1987
0.88
+0.025
2.88%
jan 1, 1988
0.897
+0.017
1.92%
jan 1, 1989
0.941
+0.044
4.95%
jan 1, 1990
0.938
-0.003
-0.31%
jan 1, 1991
0.976
+0.038
4.08%
jan 1, 1992
1.025
+0.049
5.03%
jan 1, 1993
1.093
+0.068
6.62%
jan 1, 1994
1.05
-0.044
-3.98%
jan 1, 1995
0.998
-0.052
-4.94%
jan 1, 1996
1.006
+0.008
0.78%
jan 1, 1997
1.038
+0.032
3.19%
jan 1, 1998
1.027
-0.011
-1.08%
jan 1, 1999
1.0
-0.027
-2.61%
jan 1, 2000
1.03
+0.031
3.07%
jan 1, 2001
1.066
+0.036
3.46%
jan 1, 2002
1.069
+0.003
0.31%
jan 1, 2003
1.074
+0.005
0.44%
jan 1, 2004
1.114
+0.039
3.68%
jan 1, 2005
1.143
+0.029
2.63%
jan 1, 2006
1.164
+0.021
1.85%
jan 1, 2007
1.189
+0.025
2.13%
jan 1, 2008
1.241
+0.052
4.38%
jan 1, 2009
1.311
+0.07
5.65%
jan 1, 2010
1.345
+0.034
2.61%
jan 1, 2011
1.35
+0.005
0.37%
jan 1, 2012
1.441
+0.09
6.7%
jan 1, 2013
1.501
+0.06
4.17%
jan 1, 2014
1.429
-0.072
-4.8%
Ranking of countries by current statistics by years


Comments: