29
/
en
AIzaSyAYiBZKx7MnpbEhh9jyipgxe19OcubqV5w
April 1, 2024
36410
IBRD only
IBD
false
2
1
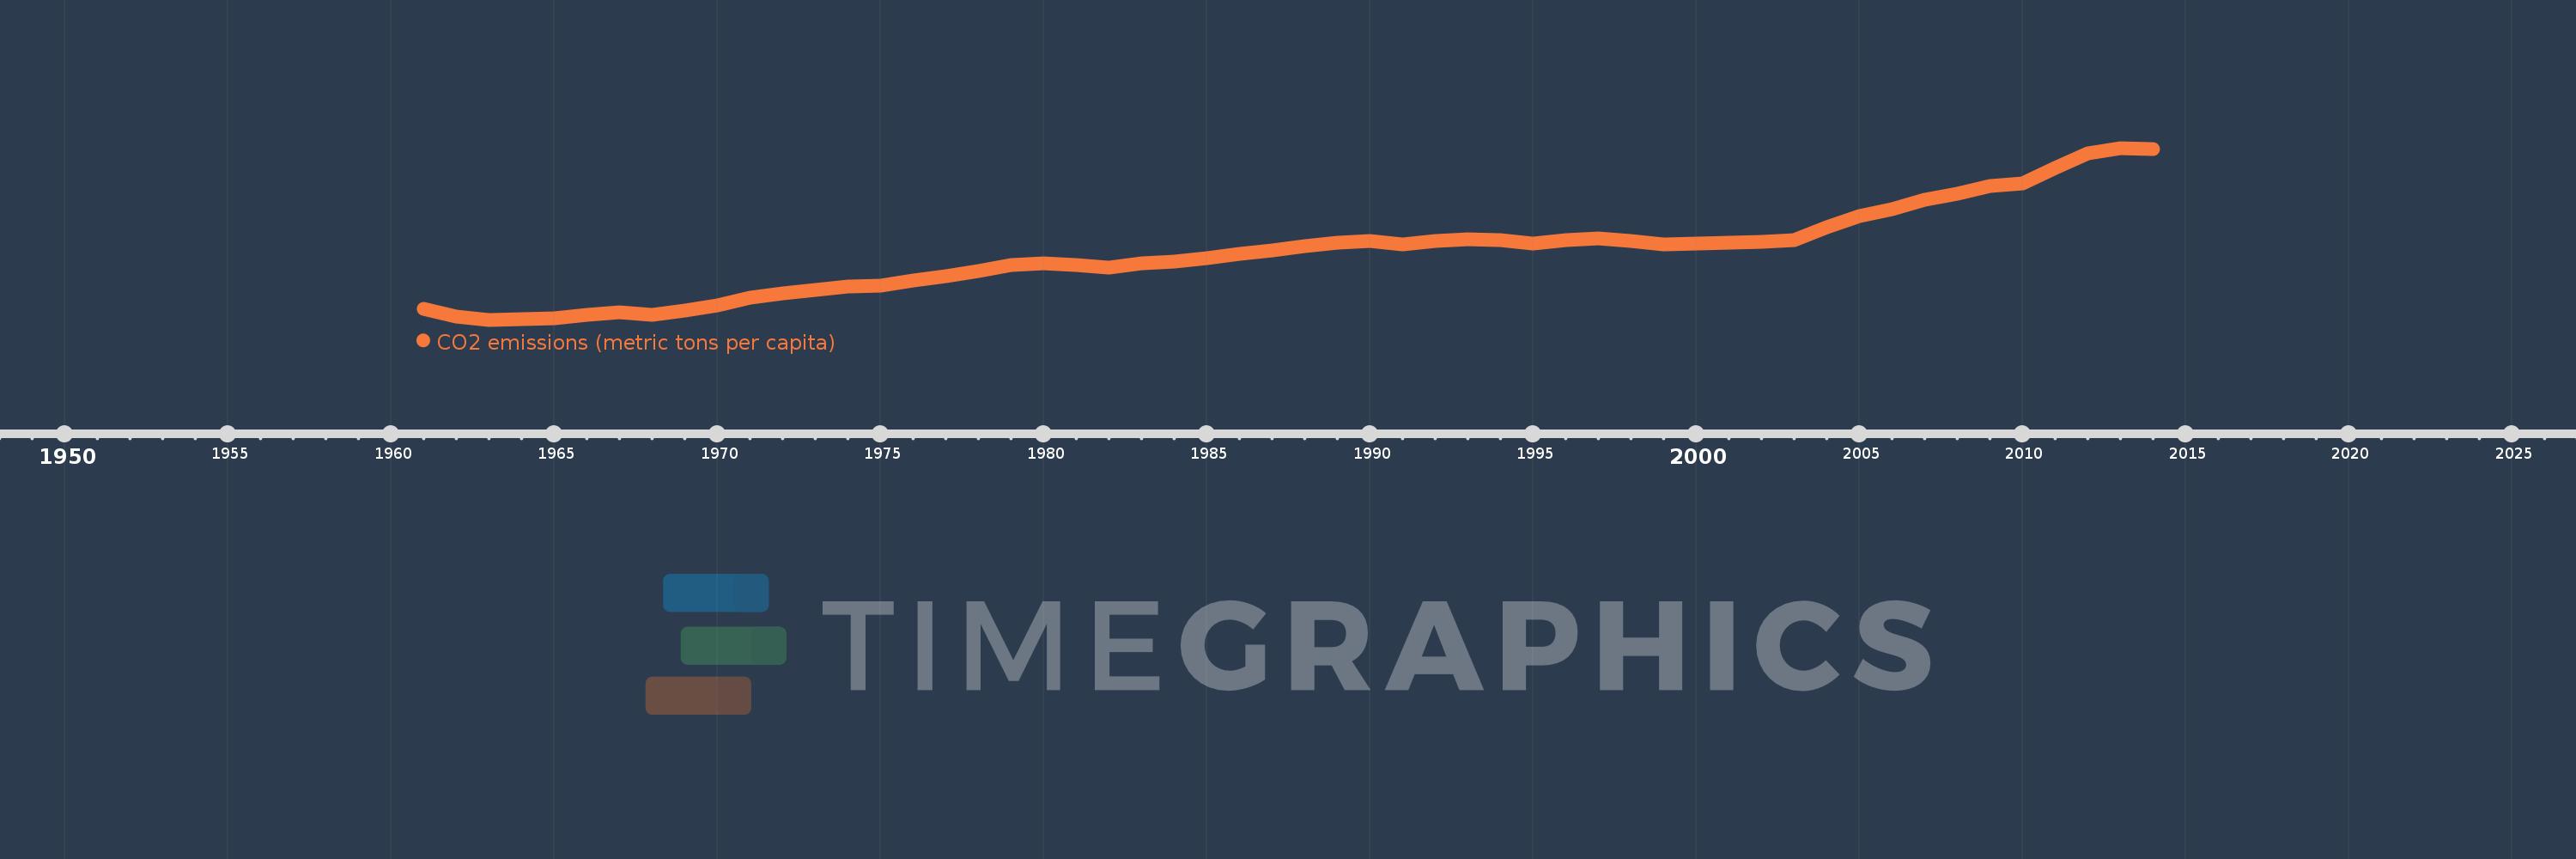
CO2 emissions (metric tons per capita)
2014,2013,2012,2011,2010,2009,2008,2007,2006,2005,2004,2003,2002,2001,2000,1999,1998,1997,1996,1995,1994,1993,1992,1991,1990,1989,1988,1987,1986,1985,1984,1983,1982,1981,1980,1979,1978,1977,1976,1975,1974,1973,1972,1971,1970,1969,1968,1967,1966,1965,1964,1963,1962,1961
This statistics in other country:
AfghanistanAlbaniaAlgeriaAndorraAngolaAntigua and BarbudaArab WorldArgentinaArmeniaArubaAustraliaAustriaAzerbaijanBahamas, TheBahrainBangladeshBarbadosBelarusBelgiumBelizeBeninBermudaBhutanBoliviaBosnia and HerzegovinaBotswanaBrazilBritish Virgin IslandsBrunei DarussalamBulgariaBurkina FasoBurundiCabo VerdeCambodiaCameroonCanadaCaribbean small statesCayman IslandsCentral African RepublicCentral Europe and the BalticsChadChileChinaColombiaComorosCongo, Dem. Rep.Congo, Rep.Costa RicaCote d'IvoireCroatiaCubaCuracaoCyprusCzech RepublicDenmarkDjiboutiDominicaDominican RepublicEarly-demographic dividendEast Asia & PacificEast Asia & Pacific (excluding high income)East Asia & Pacific (IDA & IBRD countries)EcuadorEgypt, Arab Rep.El SalvadorEquatorial GuineaEritreaEstoniaEthiopiaEuro areaEurope & Central AsiaEurope & Central Asia (excluding high income)Europe & Central Asia (IDA & IBRD countries)European UnionFaroe IslandsFijiFinlandFragile and conflict affected situationsFranceFrench PolynesiaGabonGambia, TheGeorgiaGermanyGhanaGibraltarGreeceGreenlandGrenadaGuatemalaGuineaGuinea-BissauGuyanaHaitiHeavily indebted poor countries (HIPC)High incomeHondurasHong Kong SAR, ChinaHungaryIBRD onlyIcelandIDA & IBRD totalIDA blendIDA onlyIDA totalIndiaIndonesiaIran, Islamic Rep.IraqIrelandIsraelItalyJamaicaJapanJordanKazakhstanKenyaKiribatiKorea, Dem. People’s Rep.Korea, Rep.KuwaitKyrgyz RepublicLao PDRLate-demographic dividendLatin America & Caribbean Latin America & Caribbean (excluding high income)Latin America & the Caribbean (IDA & IBRD countries)LatviaLeast developed countries: UN classificationLebanonLesothoLiberiaLibyaLiechtensteinLithuaniaLow & middle incomeLow incomeLower middle incomeLuxembourgMacao SAR, ChinaMacedonia, FYRMadagascarMalawiMalaysiaMaldivesMaliMaltaMarshall IslandsMauritaniaMauritiusMexicoMicronesia, Fed. Sts.Middle East & North AfricaMiddle East & North Africa (excluding high income)Middle East & North Africa (IDA & IBRD countries)Middle incomeMoldovaMongoliaMontenegroMoroccoMozambiqueMyanmarNamibiaNauruNepalNetherlandsNew CaledoniaNew ZealandNicaraguaNigerNigeriaNorth AmericaNorwayOECD membersOmanOther small statesPacific island small statesPakistanPalauPanamaPapua New GuineaParaguayPeruPhilippinesPolandPortugalPost-demographic dividendPre-demographic dividendQatarRomaniaRussian FederationRwandaSamoaSao Tome and PrincipeSaudi ArabiaSenegalSerbiaSeychellesSierra LeoneSingaporeSint Maarten (Dutch part)Slovak RepublicSloveniaSmall statesSolomon IslandsSomaliaSouth AfricaSouth AsiaSouth Asia (IDA & IBRD)South SudanSpainSri LankaSt. Kitts and NevisSt. LuciaSt. Vincent and the GrenadinesSub-Saharan Africa Sub-Saharan Africa (excluding high income)Sub-Saharan Africa (IDA & IBRD countries)SudanSurinameSwazilandSwedenSwitzerlandSyrian Arab RepublicTajikistanTanzaniaThailandTimor-LesteTogoTongaTrinidad and TobagoTunisiaTurkeyTurkmenistanTurks and Caicos IslandsUgandaUkraineUnited Arab EmiratesUnited KingdomUnited StatesUpper middle incomeUruguayUzbekistanVanuatuVenezuela, RBVietnamWest Bank and GazaWorldYemen, Rep.ZambiaZimbabwe Timeline:
This timeline shows a graph from 1961 to 2014 of IBRD only. No data until 1960. Number of actual observations by date: 54.
Source name:
World Development Indicators
Source organization:
Carbon Dioxide Information Analysis Center, Environmental Sciences Division, Oak Ridge National Laboratory, Tennessee, United States.
Categories, topics:
Climate Change, Environment
Last updated:
apr 23, 2017
Indicators value changes by year
At the date of observation
Value
Absolute change
Change from previous value
jan 1, 1961
1.36
+1.36
0.0%
jan 1, 1962
1.197
-0.163
-12.0%
jan 1, 1963
1.137
-0.06
-5.04%
jan 1, 1964
1.147
+0.011
0.93%
jan 1, 1965
1.175
+0.028
2.47%
jan 1, 1966
1.233
+0.057
4.87%
jan 1, 1967
1.287
+0.054
4.41%
jan 1, 1968
1.24
-0.047
-3.63%
jan 1, 1969
1.322
+0.082
6.58%
jan 1, 1970
1.428
+0.106
8.01%
jan 1, 1971
1.585
+0.157
10.99%
jan 1, 1972
1.679
+0.094
5.93%
jan 1, 1973
1.734
+0.055
3.26%
jan 1, 1974
1.801
+0.067
3.88%
jan 1, 1975
1.821
+0.02
1.1%
jan 1, 1976
1.931
+0.11
6.04%
jan 1, 1977
2.019
+0.088
4.55%
jan 1, 1978
2.115
+0.096
4.76%
jan 1, 1979
2.236
+0.121
5.72%
jan 1, 1980
2.274
+0.038
1.71%
jan 1, 1981
2.252
-0.021
-0.94%
jan 1, 1982
2.191
-0.061
-2.71%
jan 1, 1983
2.275
+0.084
3.82%
jan 1, 1984
2.311
+0.036
1.58%
jan 1, 1985
2.378
+0.067
2.91%
jan 1, 1986
2.475
+0.097
4.06%
jan 1, 1987
2.533
+0.058
2.36%
jan 1, 1988
2.622
+0.089
3.5%
jan 1, 1989
2.699
+0.077
2.93%
jan 1, 1990
2.733
+0.034
1.26%
jan 1, 1991
2.666
-0.067
-2.43%
jan 1, 1992
2.729
+0.062
2.34%
jan 1, 1993
2.768
+0.039
1.42%
jan 1, 1994
2.739
-0.028
-1.02%
jan 1, 1995
2.677
-0.062
-2.26%
jan 1, 1996
2.745
+0.068
2.55%
jan 1, 1997
2.782
+0.036
1.32%
jan 1, 1998
2.735
-0.047
-1.69%
jan 1, 1999
2.659
-0.076
-2.77%
jan 1, 2000
2.672
+0.013
0.51%
jan 1, 2001
2.689
+0.017
0.63%
jan 1, 2002
2.71
+0.02
0.76%
jan 1, 2003
2.745
+0.036
1.32%
jan 1, 2004
3.007
+0.262
9.53%
jan 1, 2005
3.23
+0.223
7.41%
jan 1, 2006
3.37
+0.14
4.35%
jan 1, 2007
3.564
+0.194
5.75%
jan 1, 2008
3.688
+0.124
3.48%
jan 1, 2009
3.84
+0.153
4.14%
jan 1, 2010
3.892
+0.051
1.34%
jan 1, 2011
4.204
+0.312
8.03%
jan 1, 2012
4.495
+0.291
6.92%
jan 1, 2013
4.612
+0.117
2.59%
jan 1, 2014
4.588
-0.023
-0.5%
Ranking of countries by current statistics by years


Comments: