29
/
en
AIzaSyAYiBZKx7MnpbEhh9jyipgxe19OcubqV5w
April 1, 2024
171506
Kuwait
KWT
true
2
1
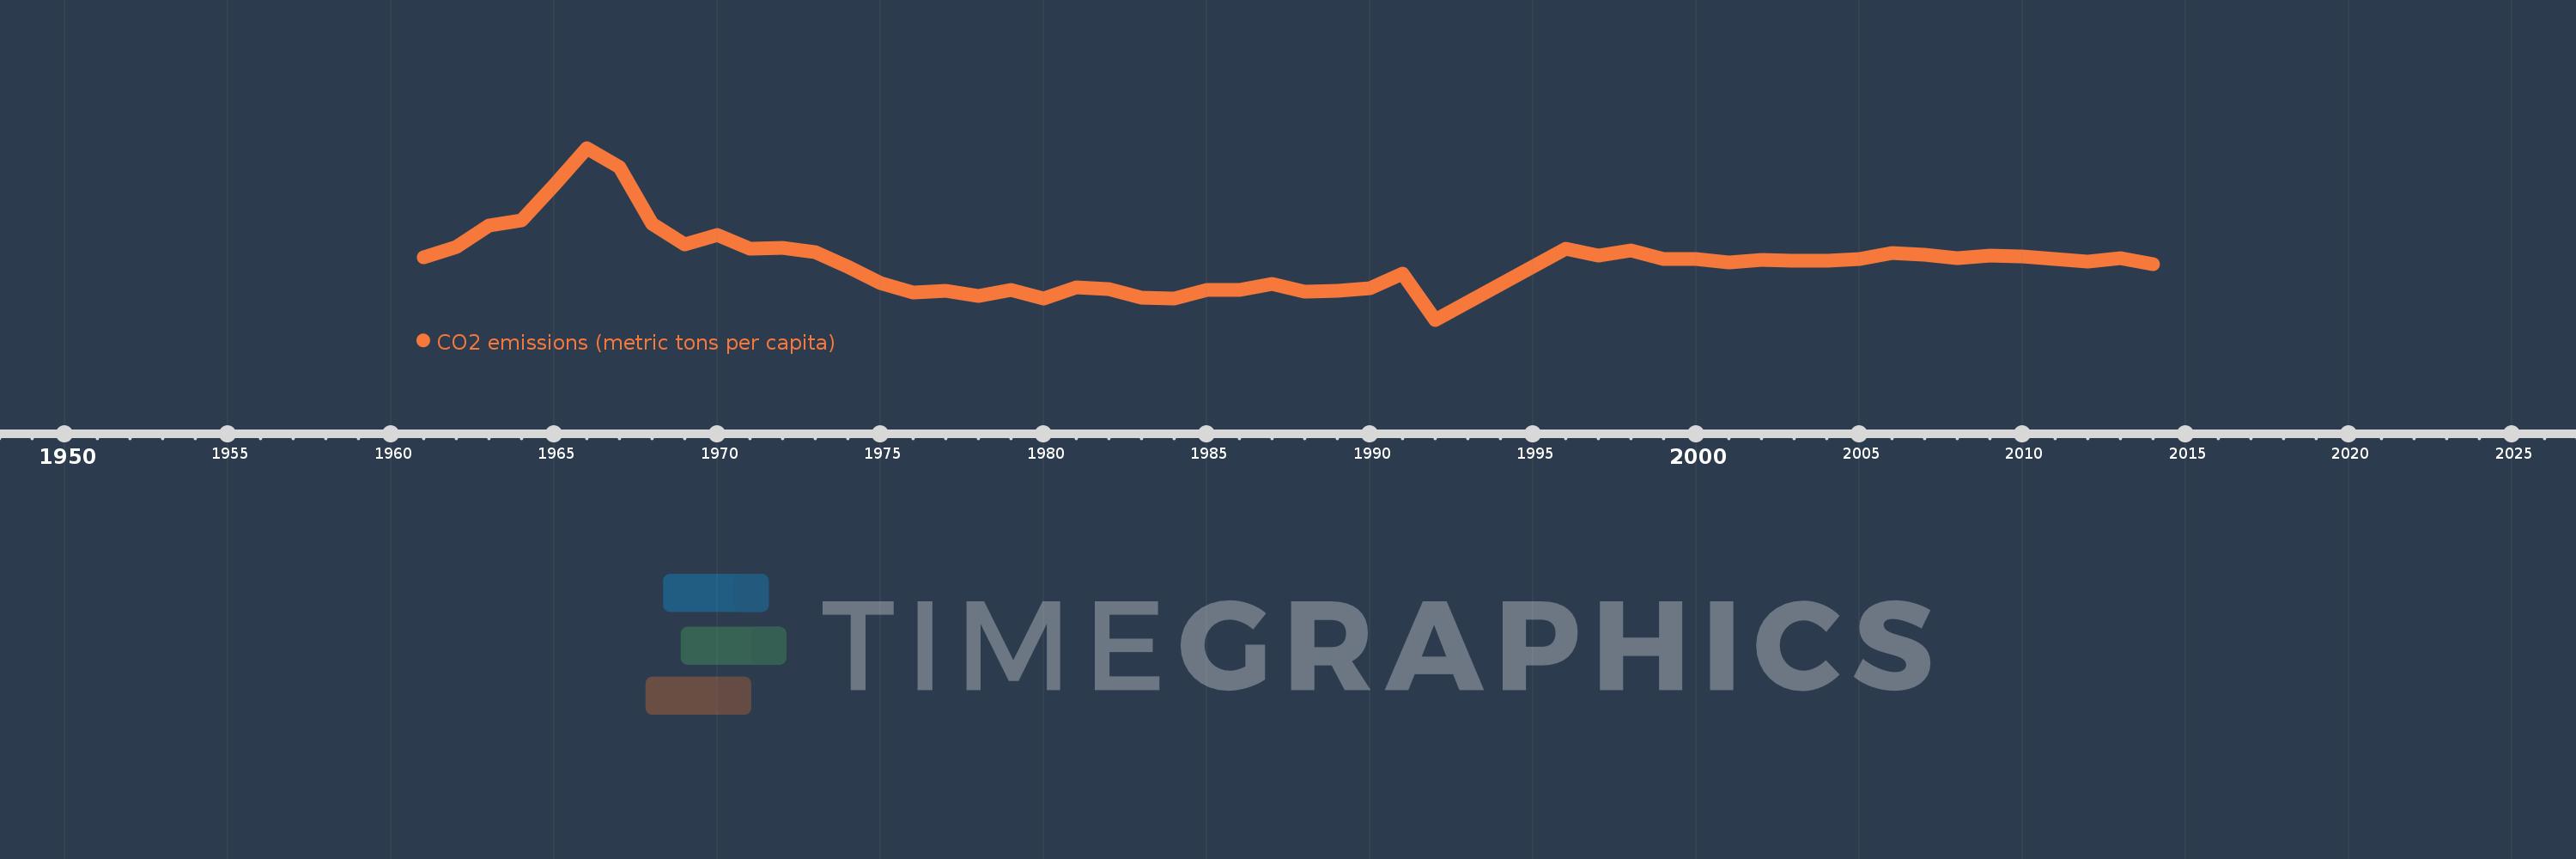
CO2 emissions (metric tons per capita)
2014,2013,2012,2011,2010,2009,2008,2007,2006,2005,2004,2003,2002,2001,2000,1999,1998,1997,1996,1992,1991,1990,1989,1988,1987,1986,1985,1984,1983,1982,1981,1980,1979,1978,1977,1976,1975,1974,1973,1972,1971,1970,1969,1968,1967,1966,1965,1964,1963,1962,1961
This statistics in other country:
AfghanistanAlbaniaAlgeriaAndorraAngolaAntigua and BarbudaArab WorldArgentinaArmeniaArubaAustraliaAustriaAzerbaijanBahamas, TheBahrainBangladeshBarbadosBelarusBelgiumBelizeBeninBermudaBhutanBoliviaBosnia and HerzegovinaBotswanaBrazilBritish Virgin IslandsBrunei DarussalamBulgariaBurkina FasoBurundiCabo VerdeCambodiaCameroonCanadaCaribbean small statesCayman IslandsCentral African RepublicCentral Europe and the BalticsChadChileChinaColombiaComorosCongo, Dem. Rep.Congo, Rep.Costa RicaCote d'IvoireCroatiaCubaCuracaoCyprusCzech RepublicDenmarkDjiboutiDominicaDominican RepublicEarly-demographic dividendEast Asia & PacificEast Asia & Pacific (excluding high income)East Asia & Pacific (IDA & IBRD countries)EcuadorEgypt, Arab Rep.El SalvadorEquatorial GuineaEritreaEstoniaEthiopiaEuro areaEurope & Central AsiaEurope & Central Asia (excluding high income)Europe & Central Asia (IDA & IBRD countries)European UnionFaroe IslandsFijiFinlandFragile and conflict affected situationsFranceFrench PolynesiaGabonGambia, TheGeorgiaGermanyGhanaGibraltarGreeceGreenlandGrenadaGuatemalaGuineaGuinea-BissauGuyanaHaitiHeavily indebted poor countries (HIPC)High incomeHondurasHong Kong SAR, ChinaHungaryIBRD onlyIcelandIDA & IBRD totalIDA blendIDA onlyIDA totalIndiaIndonesiaIran, Islamic Rep.IraqIrelandIsraelItalyJamaicaJapanJordanKazakhstanKenyaKiribatiKorea, Dem. People’s Rep.Korea, Rep.KuwaitKyrgyz RepublicLao PDRLate-demographic dividendLatin America & Caribbean Latin America & Caribbean (excluding high income)Latin America & the Caribbean (IDA & IBRD countries)LatviaLeast developed countries: UN classificationLebanonLesothoLiberiaLibyaLiechtensteinLithuaniaLow & middle incomeLow incomeLower middle incomeLuxembourgMacao SAR, ChinaMacedonia, FYRMadagascarMalawiMalaysiaMaldivesMaliMaltaMarshall IslandsMauritaniaMauritiusMexicoMicronesia, Fed. Sts.Middle East & North AfricaMiddle East & North Africa (excluding high income)Middle East & North Africa (IDA & IBRD countries)Middle incomeMoldovaMongoliaMontenegroMoroccoMozambiqueMyanmarNamibiaNauruNepalNetherlandsNew CaledoniaNew ZealandNicaraguaNigerNigeriaNorth AmericaNorwayOECD membersOmanOther small statesPacific island small statesPakistanPalauPanamaPapua New GuineaParaguayPeruPhilippinesPolandPortugalPost-demographic dividendPre-demographic dividendQatarRomaniaRussian FederationRwandaSamoaSao Tome and PrincipeSaudi ArabiaSenegalSerbiaSeychellesSierra LeoneSingaporeSint Maarten (Dutch part)Slovak RepublicSloveniaSmall statesSolomon IslandsSomaliaSouth AfricaSouth AsiaSouth Asia (IDA & IBRD)South SudanSpainSri LankaSt. Kitts and NevisSt. LuciaSt. Vincent and the GrenadinesSub-Saharan Africa Sub-Saharan Africa (excluding high income)Sub-Saharan Africa (IDA & IBRD countries)SudanSurinameSwazilandSwedenSwitzerlandSyrian Arab RepublicTajikistanTanzaniaThailandTimor-LesteTogoTongaTrinidad and TobagoTunisiaTurkeyTurkmenistanTurks and Caicos IslandsUgandaUkraineUnited Arab EmiratesUnited KingdomUnited StatesUpper middle incomeUruguayUzbekistanVanuatuVenezuela, RBVietnamWest Bank and GazaWorldYemen, Rep.ZambiaZimbabwe Timeline:
This timeline shows a graph from 1961 to 2014 of Kuwait. No data until 1960. Number of actual observations by date: 51.
Source name:
World Development Indicators
Source organization:
Carbon Dioxide Information Analysis Center, Environmental Sciences Division, Oak Ridge National Laboratory, Tennessee, United States.
Categories, topics:
Climate Change, Environment
Last updated:
apr 23, 2017
Indicators value changes by year
Maximum:
73.458
jan 1, 1966
At the date of observation
Value
Absolute change
Change from previous value
jan 1, 1961
29.788
+29.788
0.0%
jan 1, 1962
33.877
+4.089
13.73%
jan 1, 1963
42.637
+8.76
25.86%
jan 1, 1964
44.609
+1.972
4.63%
jan 1, 1965
58.733
+14.123
31.66%
jan 1, 1966
73.458
+14.725
25.07%
jan 1, 1967
65.887
-7.572
-10.31%
jan 1, 1968
43.428
-22.458
-34.09%
jan 1, 1969
35.111
-8.317
-19.15%
jan 1, 1970
38.669
+3.558
10.13%
jan 1, 1971
33.381
-5.288
-13.67%
jan 1, 1972
33.593
+0.212
0.63%
jan 1, 1973
31.883
-1.71
-5.09%
jan 1, 1974
26.157
-5.726
-17.96%
jan 1, 1975
19.558
-6.599
-25.23%
jan 1, 1976
16.008
-3.55
-18.15%
jan 1, 1977
16.562
+0.554
3.46%
jan 1, 1978
14.582
-1.98
-11.96%
jan 1, 1979
16.833
+2.251
15.44%
jan 1, 1980
13.431
-3.402
-20.21%
jan 1, 1981
17.825
+4.393
32.71%
jan 1, 1982
17.361
-0.464
-2.6%
jan 1, 1983
13.938
-3.423
-19.72%
jan 1, 1984
13.623
-0.314
-2.26%
jan 1, 1985
17.111
+3.487
25.6%
jan 1, 1986
16.804
-0.307
-1.79%
jan 1, 1987
19.373
+2.569
15.29%
jan 1, 1988
16.408
-2.965
-15.3%
jan 1, 1989
16.436
+0.028
0.17%
jan 1, 1990
17.467
+1.031
6.28%
jan 1, 1991
23.466
+5.999
34.34%
jan 1, 1992
5.077
-18.389
-78.36%
jan 1, 1996
33.488
+28.411
559.58%
jan 1, 1997
30.621
-2.868
-8.56%
jan 1, 1998
32.57
+1.949
6.37%
jan 1, 1999
29.297
-3.273
-10.05%
jan 1, 2000
29.152
-0.145
-0.5%
jan 1, 2001
27.759
-1.393
-4.78%
jan 1, 2002
28.965
+1.206
4.35%
jan 1, 2003
28.512
-0.453
-1.56%
jan 1, 2004
28.589
+0.077
0.27%
jan 1, 2005
29.328
+0.739
2.58%
jan 1, 2006
31.607
+2.28
7.77%
jan 1, 2007
30.872
-0.735
-2.33%
jan 1, 2008
29.637
-1.235
-4.0%
jan 1, 2009
30.581
+0.944
3.19%
jan 1, 2010
30.301
-0.28
-0.92%
jan 1, 2011
29.294
-1.006
-3.32%
jan 1, 2012
28.103
-1.192
-4.07%
jan 1, 2013
29.579
+1.476
5.25%
jan 1, 2014
27.259
-2.32
-7.84%
Ranking of countries by current statistics by years


Comments: