29
/
en
AIzaSyAYiBZKx7MnpbEhh9jyipgxe19OcubqV5w
April 1, 2024
131780
Fiji
FJI
true
2
1
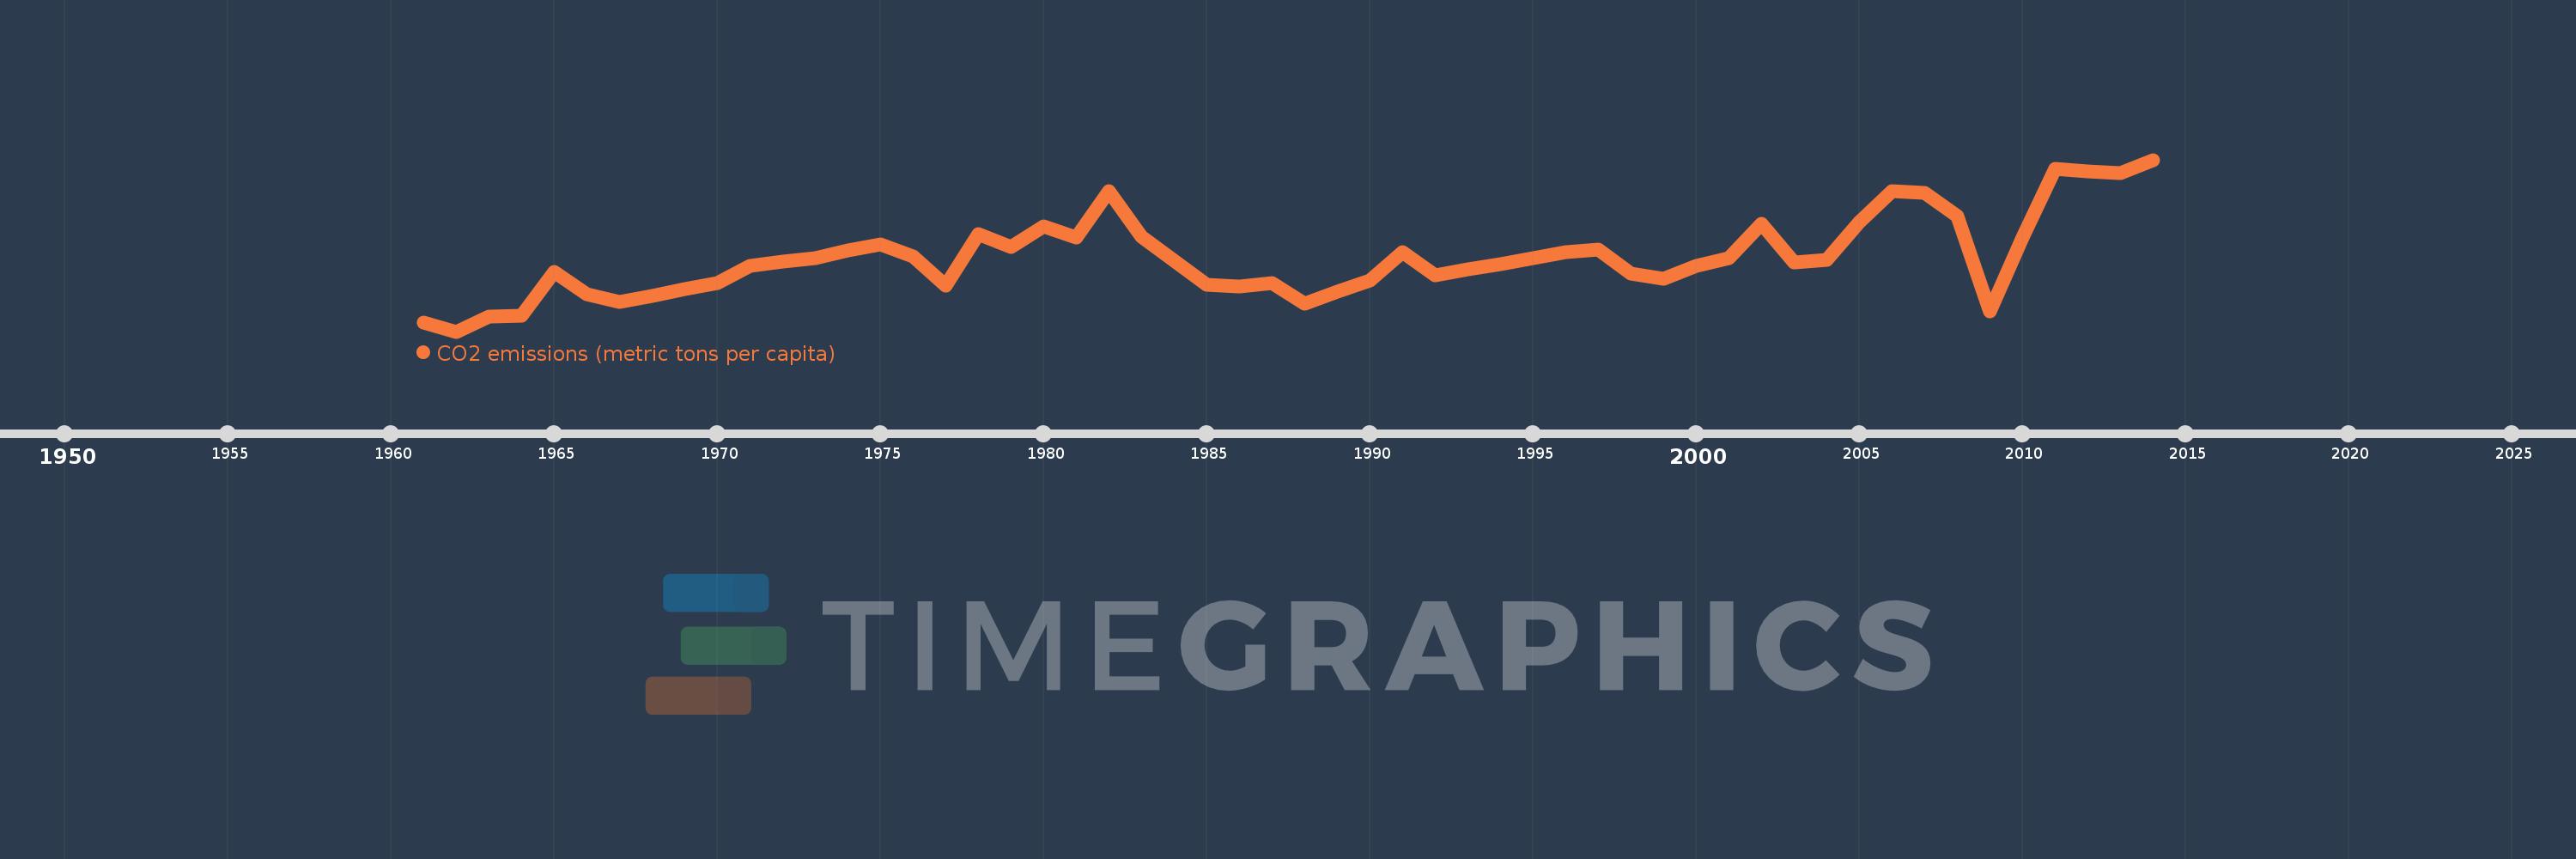
CO2 emissions (metric tons per capita)
2014,2013,2012,2011,2010,2009,2008,2007,2006,2005,2004,2003,2002,2001,2000,1999,1998,1997,1996,1995,1994,1993,1992,1991,1990,1989,1988,1987,1986,1985,1984,1983,1982,1981,1980,1979,1978,1977,1976,1975,1974,1973,1972,1971,1970,1969,1968,1967,1966,1965,1964,1963,1962,1961
This statistics in other country:
AfghanistanAlbaniaAlgeriaAndorraAngolaAntigua and BarbudaArab WorldArgentinaArmeniaArubaAustraliaAustriaAzerbaijanBahamas, TheBahrainBangladeshBarbadosBelarusBelgiumBelizeBeninBermudaBhutanBoliviaBosnia and HerzegovinaBotswanaBrazilBritish Virgin IslandsBrunei DarussalamBulgariaBurkina FasoBurundiCabo VerdeCambodiaCameroonCanadaCaribbean small statesCayman IslandsCentral African RepublicCentral Europe and the BalticsChadChileChinaColombiaComorosCongo, Dem. Rep.Congo, Rep.Costa RicaCote d'IvoireCroatiaCubaCuracaoCyprusCzech RepublicDenmarkDjiboutiDominicaDominican RepublicEarly-demographic dividendEast Asia & PacificEast Asia & Pacific (excluding high income)East Asia & Pacific (IDA & IBRD countries)EcuadorEgypt, Arab Rep.El SalvadorEquatorial GuineaEritreaEstoniaEthiopiaEuro areaEurope & Central AsiaEurope & Central Asia (excluding high income)Europe & Central Asia (IDA & IBRD countries)European UnionFaroe IslandsFijiFinlandFragile and conflict affected situationsFranceFrench PolynesiaGabonGambia, TheGeorgiaGermanyGhanaGibraltarGreeceGreenlandGrenadaGuatemalaGuineaGuinea-BissauGuyanaHaitiHeavily indebted poor countries (HIPC)High incomeHondurasHong Kong SAR, ChinaHungaryIBRD onlyIcelandIDA & IBRD totalIDA blendIDA onlyIDA totalIndiaIndonesiaIran, Islamic Rep.IraqIrelandIsraelItalyJamaicaJapanJordanKazakhstanKenyaKiribatiKorea, Dem. People’s Rep.Korea, Rep.KuwaitKyrgyz RepublicLao PDRLate-demographic dividendLatin America & Caribbean Latin America & Caribbean (excluding high income)Latin America & the Caribbean (IDA & IBRD countries)LatviaLeast developed countries: UN classificationLebanonLesothoLiberiaLibyaLiechtensteinLithuaniaLow & middle incomeLow incomeLower middle incomeLuxembourgMacao SAR, ChinaMacedonia, FYRMadagascarMalawiMalaysiaMaldivesMaliMaltaMarshall IslandsMauritaniaMauritiusMexicoMicronesia, Fed. Sts.Middle East & North AfricaMiddle East & North Africa (excluding high income)Middle East & North Africa (IDA & IBRD countries)Middle incomeMoldovaMongoliaMontenegroMoroccoMozambiqueMyanmarNamibiaNauruNepalNetherlandsNew CaledoniaNew ZealandNicaraguaNigerNigeriaNorth AmericaNorwayOECD membersOmanOther small statesPacific island small statesPakistanPalauPanamaPapua New GuineaParaguayPeruPhilippinesPolandPortugalPost-demographic dividendPre-demographic dividendQatarRomaniaRussian FederationRwandaSamoaSao Tome and PrincipeSaudi ArabiaSenegalSerbiaSeychellesSierra LeoneSingaporeSint Maarten (Dutch part)Slovak RepublicSloveniaSmall statesSolomon IslandsSomaliaSouth AfricaSouth AsiaSouth Asia (IDA & IBRD)South SudanSpainSri LankaSt. Kitts and NevisSt. LuciaSt. Vincent and the GrenadinesSub-Saharan Africa Sub-Saharan Africa (excluding high income)Sub-Saharan Africa (IDA & IBRD countries)SudanSurinameSwazilandSwedenSwitzerlandSyrian Arab RepublicTajikistanTanzaniaThailandTimor-LesteTogoTongaTrinidad and TobagoTunisiaTurkeyTurkmenistanTurks and Caicos IslandsUgandaUkraineUnited Arab EmiratesUnited KingdomUnited StatesUpper middle incomeUruguayUzbekistanVanuatuVenezuela, RBVietnamWest Bank and GazaWorldYemen, Rep.ZambiaZimbabwe Timeline:
This timeline shows a graph from 1961 to 2014 of Fiji. No data until 1960. Number of actual observations by date: 54.
Source name:
World Development Indicators
Source organization:
Carbon Dioxide Information Analysis Center, Environmental Sciences Division, Oak Ridge National Laboratory, Tennessee, United States.
Categories, topics:
Climate Change, Environment
Last updated:
apr 23, 2017
Indicators value changes by year
At the date of observation
Value
Absolute change
Change from previous value
jan 1, 1961
0.494
+0.494
0.0%
jan 1, 1962
0.414
-0.08
-16.14%
jan 1, 1963
0.548
+0.134
32.27%
jan 1, 1964
0.555
+0.007
1.25%
jan 1, 1965
0.944
+0.389
70.2%
jan 1, 1966
0.743
-0.201
-21.31%
jan 1, 1967
0.677
-0.066
-8.83%
jan 1, 1968
0.729
+0.052
7.61%
jan 1, 1969
0.794
+0.065
8.89%
jan 1, 1970
0.849
+0.055
6.95%
jan 1, 1971
1.0
+0.151
17.83%
jan 1, 1972
1.035
+0.034
3.43%
jan 1, 1973
1.067
+0.033
3.16%
jan 1, 1974
1.138
+0.071
6.64%
jan 1, 1975
1.187
+0.049
4.27%
jan 1, 1976
1.081
-0.106
-8.91%
jan 1, 1977
0.824
-0.257
-23.8%
jan 1, 1978
1.281
+0.457
55.49%
jan 1, 1979
1.167
-0.114
-8.87%
jan 1, 1980
1.351
+0.184
15.73%
jan 1, 1981
1.253
-0.098
-7.29%
jan 1, 1982
1.662
+0.409
32.67%
jan 1, 1983
1.257
-0.405
-24.38%
jan 1, 1984
1.043
-0.213
-16.98%
jan 1, 1985
0.832
-0.211
-20.21%
jan 1, 1986
0.814
-0.018
-2.21%
jan 1, 1987
0.842
+0.028
3.43%
jan 1, 1988
0.661
-0.182
-21.56%
jan 1, 1989
0.766
+0.105
15.96%
jan 1, 1990
0.87
+0.104
13.64%
jan 1, 1991
1.122
+0.252
28.94%
jan 1, 1992
0.917
-0.205
-18.26%
jan 1, 1993
0.97
+0.053
5.76%
jan 1, 1994
1.01
+0.04
4.12%
jan 1, 1995
1.068
+0.058
5.72%
jan 1, 1996
1.121
+0.053
4.93%
jan 1, 1997
1.141
+0.02
1.77%
jan 1, 1998
0.93
-0.211
-18.49%
jan 1, 1999
0.88
-0.05
-5.37%
jan 1, 2000
0.996
+0.116
13.19%
jan 1, 2001
1.067
+0.071
7.13%
jan 1, 2002
1.369
+0.302
28.34%
jan 1, 2003
1.025
-0.344
-25.14%
jan 1, 2004
1.055
+0.03
2.95%
jan 1, 2005
1.385
+0.329
31.21%
jan 1, 2006
1.66
+0.275
19.88%
jan 1, 2007
1.644
-0.016
-0.94%
jan 1, 2008
1.441
-0.203
-12.37%
jan 1, 2009
0.596
-0.845
-58.65%
jan 1, 2010
1.253
+0.657
110.25%
jan 1, 2011
1.859
+0.607
48.42%
jan 1, 2012
1.835
-0.024
-1.31%
jan 1, 2013
1.825
-0.01
-0.55%
jan 1, 2014
1.941
+0.116
6.36%
Ranking of countries by current statistics by years


Comments: